Industrial IoT Edge Platform
A local operating layer for industrial devices, data pipelines, and operator workflows.
Industrial IoT succeeds when field connectivity, local data handling, event logic, and operations form one reliable system. An edge platform provides that system close to the equipment, where raw data can be captured and decisions can be made without making plant operations dependent on a remote service.
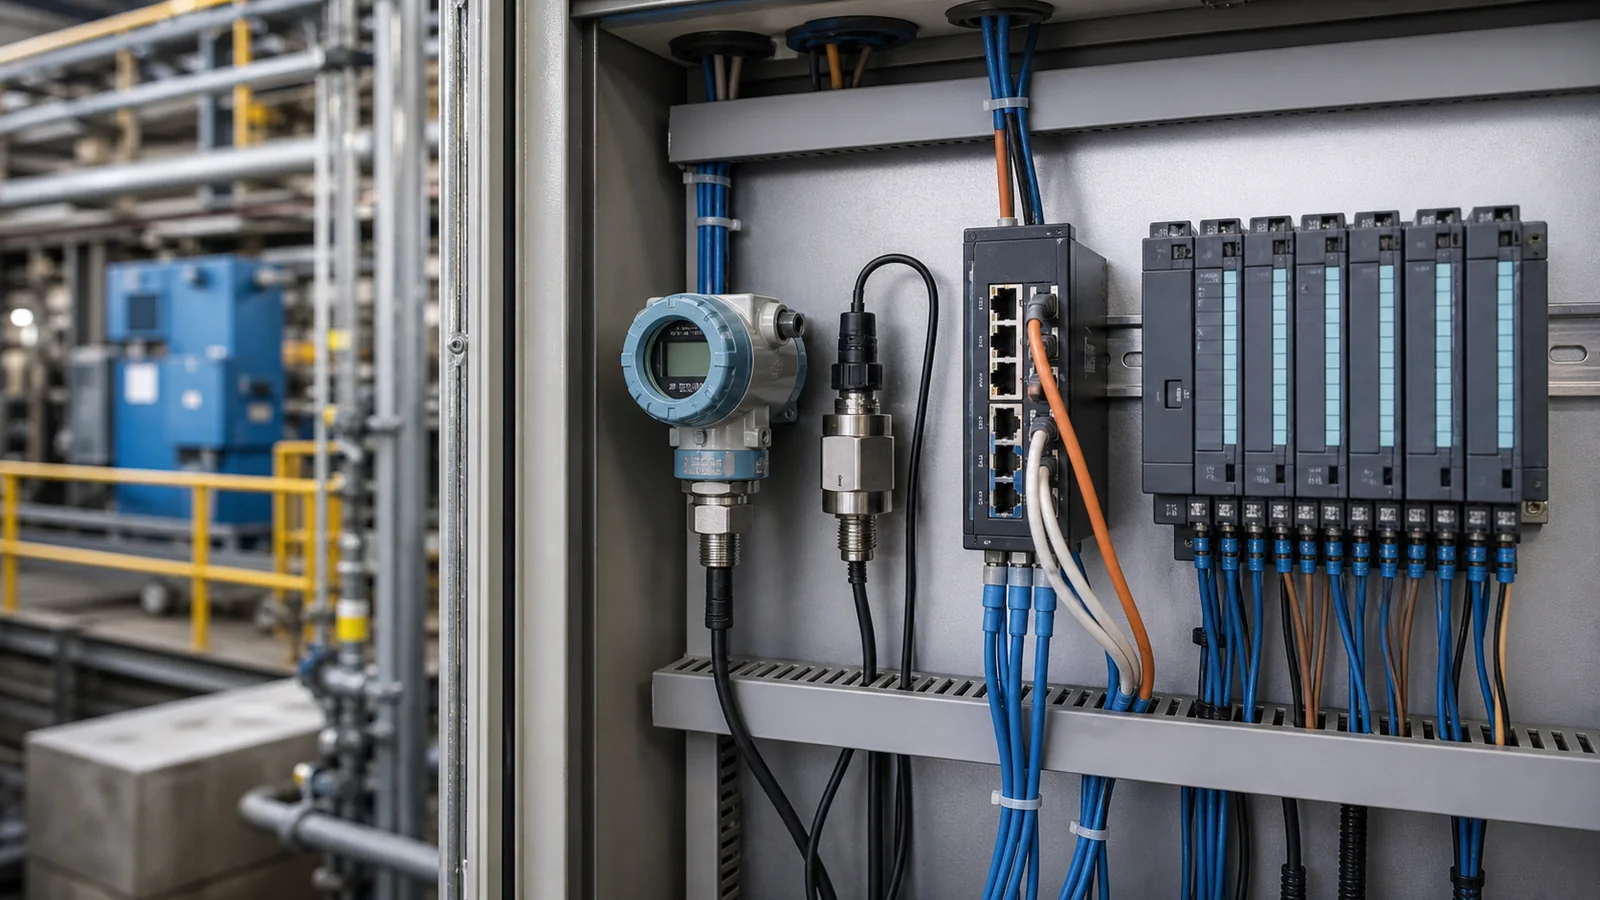
The platform is the operational boundary around industrial data
An industrial IoT deployment usually begins with a device connection: a PLC gateway, energy meter, camera, DAQ unit, vibration sensor, or machine controller. The actual engineering challenge begins after that first connection. Data must be acquired reliably, timestamped, retained where needed, interpreted by the right service, made visible to operators, and delivered to downstream systems without exposing the plant to unnecessary network or cloud dependency.
An Industrial IoT edge platform coordinates those responsibilities on local hardware. It is the layer between field devices and external consumers such as operator dashboards, historians, maintenance systems, cloud services, and analytics pipelines. It does not need to replace specialist machine logic or a team’s signal-processing code. Its purpose is to make the surrounding system observable, repeatable, and governable.
Banalytics is a local-first edge orchestration and monitoring platform for this role. Its Agent runs on a PC, industrial mini-PC, server, or ARM device close to the equipment; raw recordings and measurement data remain under the operator’s control. For an overview of the platform scope, see What is Banalytics?.
Build the data path around explicit responsibility boundaries
A practical industrial edge architecture has five layers. Field devices produce signals. Banalytics acquires and buffers those signals locally. A dedicated processing module performs domain-specific work when required. Banalytics then converts the returned result into events, dashboards, retained records, notifications, and integration messages. Downstream systems receive structured outputs rather than every raw frame, waveform, or register poll.
| Layer | Primary concern | Examples |
|---|---|---|
| Field devices | Generate measurements and operational state. | PLCs, cameras, DAQ hardware, acoustic sensors, process instruments, meters, relays. |
| Edge acquisition | Maintain connectivity, timing, buffering, and local storage. | Banalytics components, local broker, Modbus line, camera streams, file storage. |
| Domain processing | Apply specialist logic with known inputs and outputs. | Feature extraction, image analysis, waveform analysis, fusion, anomaly scoring, model inference. |
| Edge orchestration | Turn results into operational state and response. | Events, rules, dashboards, historian records, alarms, MQTT publications, remote access. |
| External consumers | Use selected, contextualised outputs. | SCADA, MES, maintenance systems, cloud historians, AI training pipelines, operator tools. |
This separation lets each layer change for the right reason. A sensor integration can be updated without rewriting the analysis model; a model can be upgraded without changing the plant’s alerting workflow; a downstream system can subscribe to stable event metadata instead of coupling itself to a raw proprietary feed. The complete industrial sensing pattern is described in How Banalytics Works for Industrial Sensing.
Deployment view: measurement, analysis, and orchestration
The deployment view below makes the boundary visible. A real-time measurement node receives raw image and sound inputs close to the instrumentation. A domain feature package performs preprocessing, feature extraction, classification or inference, and returns structured measurements. Banalytics retains the real-time acquisition path, can apply timeline analysis and rules locally, and publishes only the selected result to an MQTT consumer or a separate orchestration node.

The browser management path is separate from the raw-data critical path. An authorised user requests a connection through the Banalytics infrastructure signalling service; the local Agent continues device acquisition, processing coordination, storage, and rules at the edge. This distinction matters when high-speed or high-volume inputs would be impractical to transport continuously. The complementary Edge Orchestration Platform paper shows the same principle in a smaller two-Agent sensor-to-mobile-machine pattern.
Use the protocol that fits the operational boundary
Industrial estates are mixed by design. A useful platform must connect directly where the protocol is stable and well understood, and provide a controlled extension boundary where a vendor SDK, niche protocol, or high-throughput service is the better fit.
| Interface | Role at the edge | What Banalytics provides |
|---|---|---|
| Modbus | Read and write device state on serial and network-connected equipment. | Direct RTU devices and multi-device lines over Serial, TCP, UDP, and RTU-over-TCP; polling, state tracking, discovery, events, and controlled register/coil actions. |
| MQTT | Exchange telemetry, commands, and events with local services and IoT devices. | An embedded broker plus MQTT v3/v5 connectors, listeners, publishing actions, TLS, mutual TLS, persistence, WebSocket access, and runtime statistics. |
| ONVIF, RTSP, USB | Collect visual and audio context from physical processes. | Camera and media integration, recording, motion and sound detection, event workflows, and optional local object classification. |
| ZeroMQ | Move low-latency messages between local services or a plant-network processing module. | Configurable socket patterns, timeouts, runtime counters, listener tasks, and event-driven outbound messages. |
| Custom or proprietary interfaces | Bridge equipment that needs a vendor SDK, specialist gateway, or an existing application. | Process supervision, custom Java/CMD actions, and structured handoff through MQTT, ZeroMQ, files, databases, or APIs. |
For direct field integration, use the Modbus Line documentation. For a local event bus and IoT device connectivity, see MQTT Server. The ZeroMQ Socket page covers low-latency service-to-service transport.
Choose transport according to payload, latency, and ownership
Not every industrial workload needs the same data path. Modbus values and MQTT events are compact and naturally message-oriented. Video frames, high-rate waveforms, and multimodal captures can be much larger. Sending all of that data through a remote broker or a cloud API is often expensive, slow, and operationally fragile.

Start with the simplest transport that meets the requirement. Local ZeroMQ IPC is easy to observe and sufficient for many co-located services. ZeroMQ TCP is appropriate when acquisition and processing are separated across the plant network. Shared memory is appropriate for large frames or high-rate signals where copying becomes the bottleneck. The key is to define the contract: payload schema, timestamp source, health tags, restart behaviour, and back-pressure policy.
Make operational decisions explicit and auditable
Industrial data becomes useful when a condition is connected to a response. A Modbus value exceeds its operating band; a camera detects an unexpected object; a processing module returns a confidence score; a node reports low storage capacity. Banalytics converts those changes into events and allows the Event Manager to evaluate rules locally.
A rule can notify an operator, publish to MQTT, persist the event, switch a task state, invoke a controlled command, or send a carefully scoped device action. The right event contract contains more than a Boolean alarm: it should identify the source, timestamp, state or measurement, location, severity, confidence where relevant, and the health state of the acquisition path. See Event Manager for the runtime rule model and MQTT Publish Action for the message handoff pattern.
Important boundary: Banalytics can support monitoring, workflow, and controlled operational automation around equipment. It is not a substitute for certified functional-safety controls, hard real-time interlocks, or the safety logic already assigned to a PLC, safety relay, DCS, or SIS. Those systems should retain their intended authority.
Keep domain intelligence independent of the edge operating layer
The most maintainable Industrial IoT systems do not force every algorithm into the platform. A team may already own a Python service, a native C++ pipeline, a CUDA model, a vendor SDK, or a research algorithm. Banalytics can own the devices, lifecycle, visibility, storage, and downstream publication while that specialist module owns the sensing or decision logic.
A concrete two-Agent example is documented in Edge Orchestration Platform: a stationary Agent collects a Modbus temperature/humidity signal, exchanges a calculation with a local Python module over ZeroMQ, publishes selected values through MQTT, and a companion Agent on an RC vehicle consumes that defined message contract for its local workflow. It demonstrates why device acquisition, specialist processing, inter-Agent messaging, and the machine-side action boundary should remain explicit.

This division reduces vendor lock-in and makes a pilot easier to harden. It also makes limitations transparent. Where an estate requires a protocol or vertical capability not supplied natively-for example a proprietary device API or an OPC UA service-it should be integrated through a gateway, sidecar, or custom module and treated as an explicit part of the design, not as an implied platform feature.
Commission the platform as an operating system, not a demo
- Define the asset and data inventory. List devices, interfaces, update ownership, expected payloads, retention, and the local system that remains authoritative for safety.
- Lock the integration contract. Agree on event schemas, timestamps, health tags, retry semantics, and the downstream consumers before connecting production equipment.
- Prove one representative path. Test from field input through acquisition, processing, event generation, and operator response under realistic load and network conditions.
- Instrument the node itself. Use System Monitor to observe CPU, memory, disk, threads, WebRTC buffers, and stream activity; turn material resource conditions into alerts or retained history.
- Harden lifecycle and access. Define restart behaviour, storage retention, least-privilege access, rollback steps, and handover procedures before replicating the pattern to further lines or sites.
The aim is not to centralise every decision. It is to create a local system that can acquire, interpret, and communicate reliably while giving engineers and business operators a controlled view of the work it performs.