Edge Orchestration Platform
A practical control layer for cameras, sensors, processing modules, and physical operations.
Edge computing becomes operationally useful only when device connectivity, local processing, events, storage, and operator workflows are governed as one system. An edge orchestration platform supplies that control layer: it keeps time-sensitive data close to equipment while making the resulting state observable and actionable across sites.
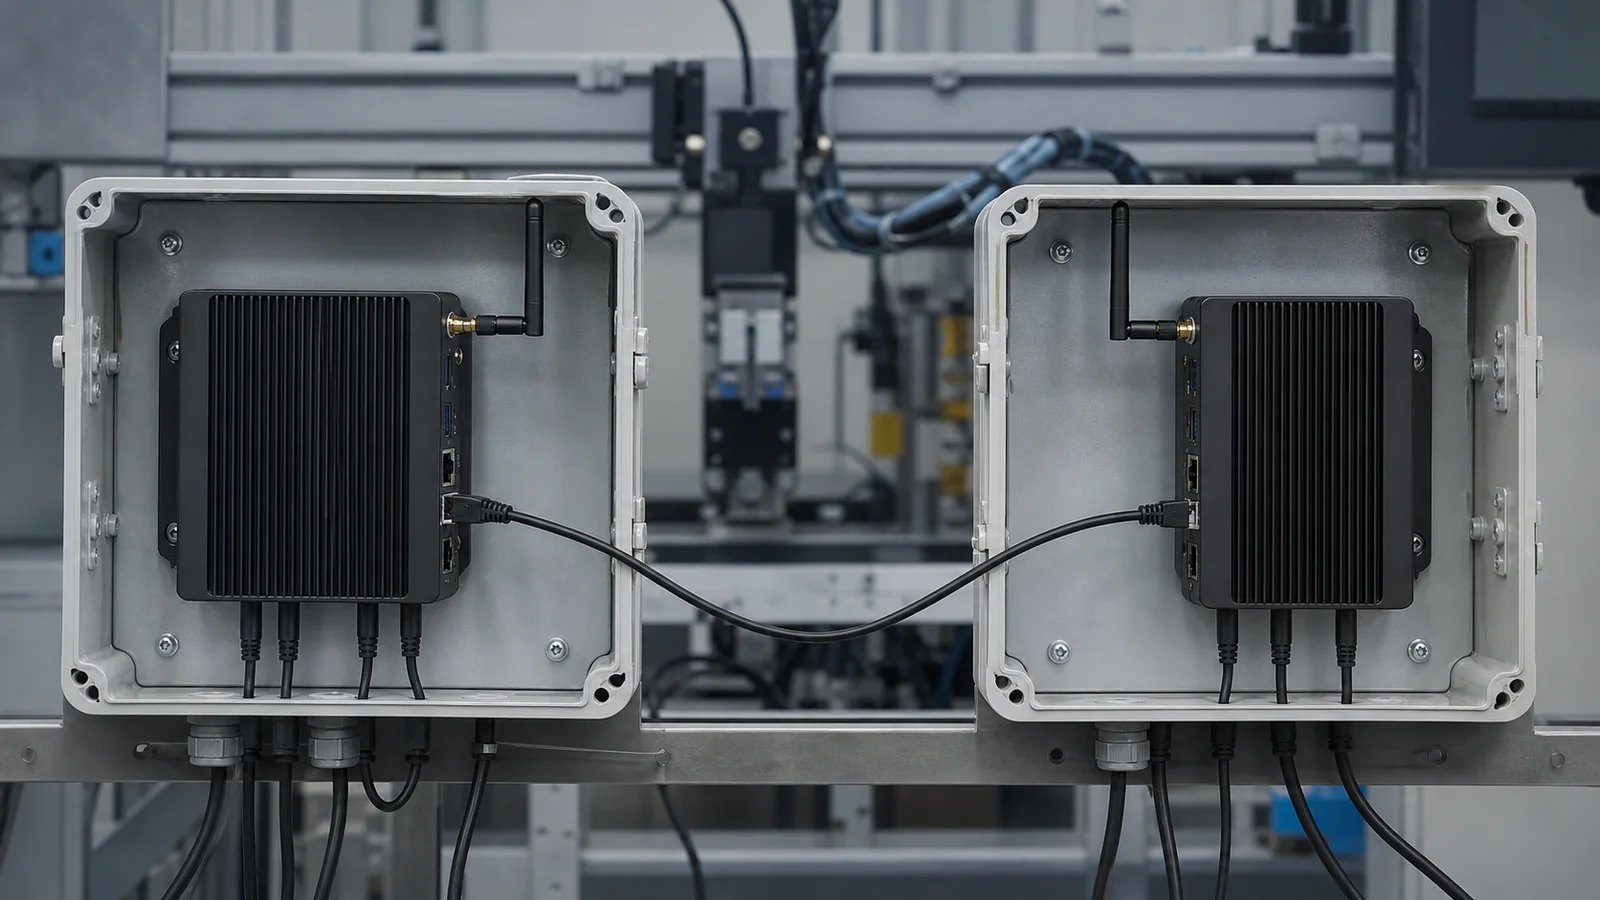
What an edge orchestration platform is
An edge orchestration platform coordinates the operational work around physical data sources. It discovers or connects devices, maintains communications, runs local tasks, records the data that must remain on site, evaluates events, and routes the resulting decisions to people and other systems.
This is a different problem from deploying a container, managing a cloud account, or installing a single camera application. The difficult part of an edge system is the boundary between hardware and operations: devices go offline, networks are intermittent, storage fills up, a detector needs to restart, and an event must still reach the right consumer with useful context. The orchestration layer owns those concerns so that domain-specific logic can remain focused on the signal, model, or business rule it was built to solve.
Banalytics implements this layer for cameras, sensors, and physical systems. A local Banalytics Agent runs on equipment owned by the operator; the browser console provides remote administration and visibility without moving raw recordings or measurement data into a mandatory cloud archive. For a platform overview, see What is Banalytics?.
Keep acquisition and intelligence separate from operations
A robust design separates the acquisition path, the domain processing module, and the operating layer. Cameras, DAQ hardware, Modbus devices, and MQTT sensors produce raw streams and measurements at the edge. A purpose-built algorithm may analyse those inputs. The orchestration platform then turns structured results into state, dashboards, retained history, notifications, and machine-to-machine messages.

A two-Agent sensor-to-mobile-machine pattern
The same orchestration model can span two independently operating Agents. In the example below, a stationary Agent reads an XY-MD02 temperature and humidity sensor through Modbus RTU. A device-state event passes JSON to a local Python processing module over ZeroMQ; the module calculates a dew-point value and returns a structured result. Event rules then publish the selected temperature, humidity, and calculated measurement through MQTT over the wireless link.
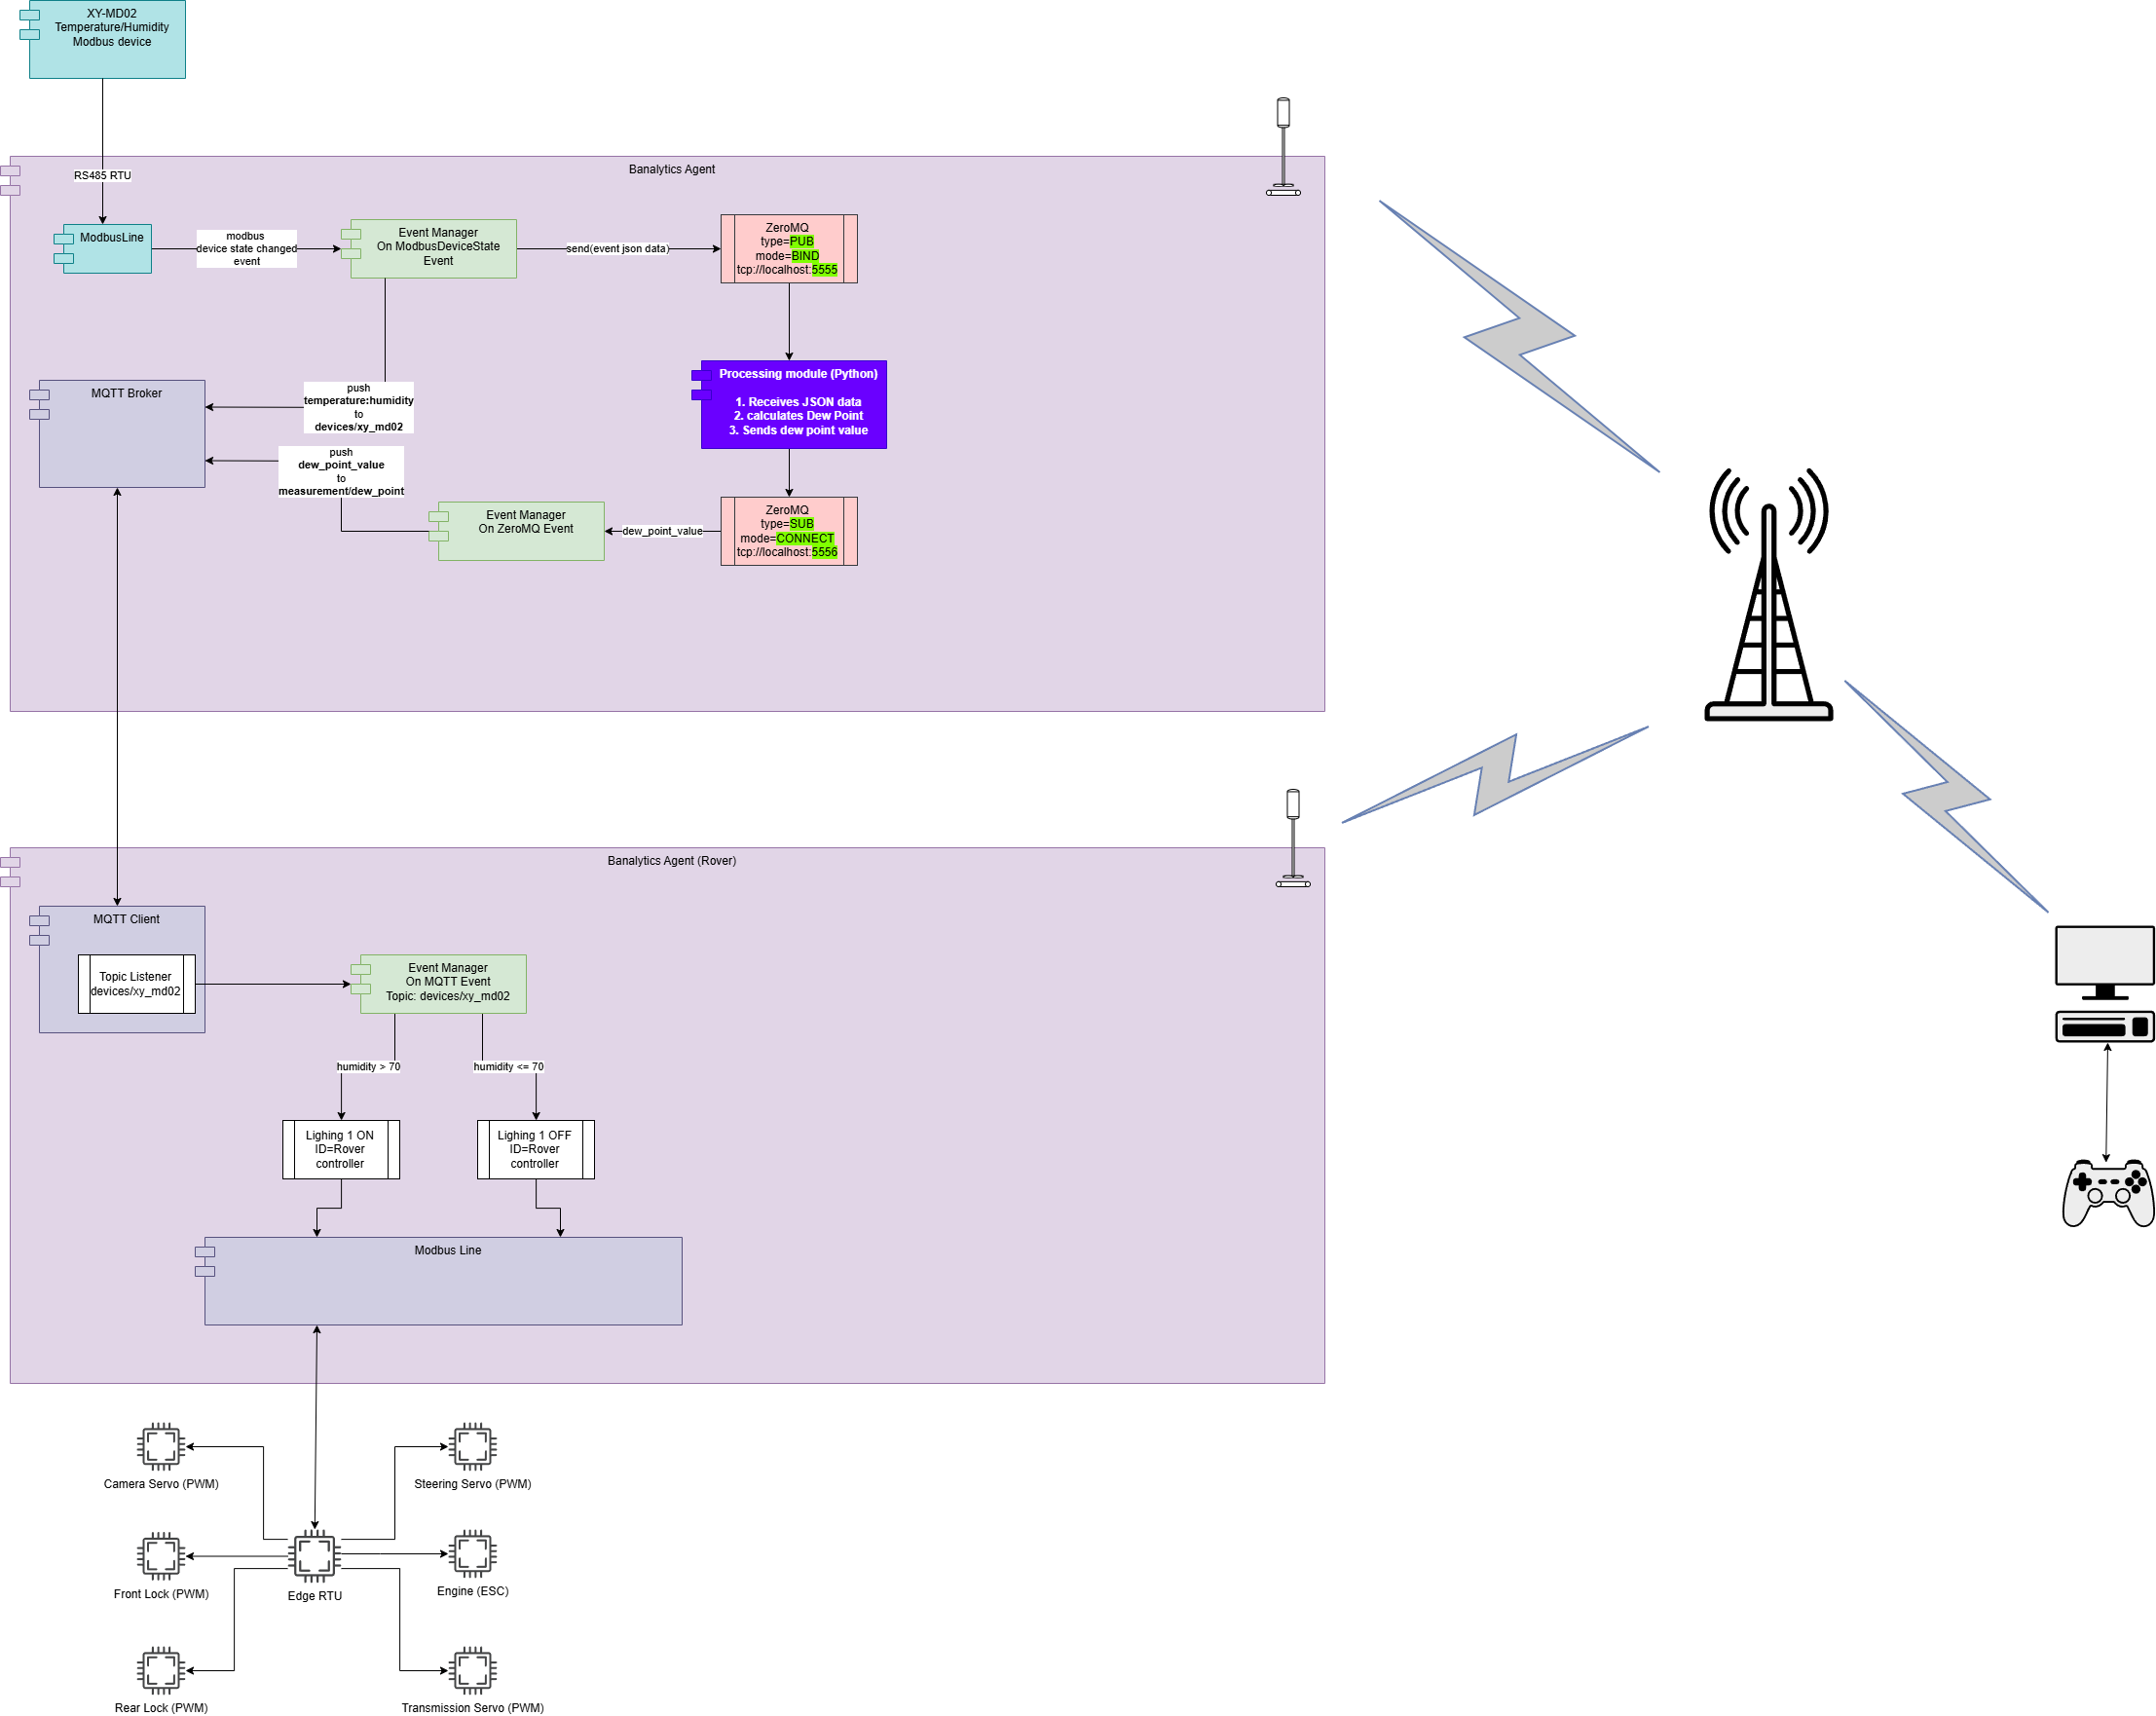
The companion Agent on the RC platform subscribes to the defined topic, evaluates the received measurement through Event Manager, and applies the approved action to its local Modbus-connected actuator interface. Each Agent remains responsible for its own local device connection, state, and recovery; MQTT is the explicit inter-Agent data contract, not an implicit shared process. See Modbus Line, ZeroMQ Socket, MQTT Server, and MQTT Topic Listener for the component boundaries used in this pattern.
Control boundary: the example is suitable for supervised, low-risk automation and prototyping. A mobile machine must retain its own independently engineered safety mechanisms, manual override, communication-loss behaviour, and emergency stop; a received telemetry message must not be treated as a safety interlock.
In an industrial sensing deployment, for example, the processing module may perform acoustic analysis, image processing, fusion, or confidence scoring. Banalytics handles the surrounding system: connectivity, buffering, local storage, lifecycle, rules, dashboards, MQTT publication, and remote operator access. The detailed pattern is documented in How Banalytics Works for Industrial Sensing. For a deployment-level view of high-volume real-time measurement, independent analysis, selected MQTT delivery, and a separate orchestration node, see Industrial IoT Edge Platform.
From a device event to an operational decision
| Layer | Responsibility | Typical Banalytics capability |
|---|---|---|
| Device connectivity | Reach equipment through appropriate local protocols and recover from normal communication failures. | ONVIF, RTSP, USB, Modbus RTU/TCP, MQTT, ZeroMQ, network discovery, and agent connectors. |
| Local execution | Run acquisition, detection, recording, and control tasks where the equipment and data reside. | Components, tasks, local file storage, configurable restart behaviour, and custom Java/CMD/Process extensions. |
| Event orchestration | Evaluate state changes and initiate the correct response. | Event Manager rules, filtering, calendars, action groups, notifications, MQTT publishing, device commands, and task lifecycle actions. |
| Operational visibility | Present health, events, recordings, dashboards, and configuration to authorised users. | Browser console, agent-owned dashboards, event history, access controls, P2P/WebRTC remote sessions, and System Monitor. |
| External integration | Expose only the events, metadata, and data packages that downstream systems require. | MQTT, APIs, file-based handoff, databases, ZeroMQ, and controlled custom integrations. |
The value of this model is not that every deployment uses every integration. It is that a camera-only installation, an instrumented production line, and a distributed AI data-collection project can use the same operational vocabulary: source, task, event, rule, action, storage, and health.
Orchestration must include change management
Edge installations are not static. Hardware changes, protocol adapters are introduced, models are updated, and sites develop independently. A platform therefore needs a predictable way to add capability, inspect its version, apply an update, and roll back when a change is unsuitable for production.
Banalytics packages capability into independently versioned modules. The local agent performs the work; the portal is used to inspect servers and select installed module versions. This design keeps a deployment lean while allowing a site to add media, ONVIF, dashboard, AI, or other capabilities as its scope grows. The module catalogue and upgrade model are documented in Banalytics Modules and Version and Module Management.

At runtime, the model is deliberately explicit: components represent connected resources; tasks perform work on their data; events carry state changes; and actions express the response. This makes it possible to review a system as an operating design rather than as a collection of independent scripts.
Local-first is an operational property, not a storage preference
Physical systems continue to produce data when the upstream network is slow or unavailable. An edge platform must therefore preserve the local acquisition and response path. Banalytics agents run independently at each location: data processing, recording, detection, and local rules take place on the host near the devices. The remote console is a management and visibility layer, not the place where a camera stream or a sensor signal must first be processed.
Local resilience also depends on observing the node itself. The System Monitor publishes CPU load, memory use, disk capacity, thread counters, WebRTC buffers, and media-stream activity as events that can be displayed, recorded, or used to trigger rules. This allows an operator to act before a full disk, resource exhaustion, or an overloaded stream turns into data loss.
For multi-site environments, each site keeps its local boundary while authorised users obtain a single browser view of the participating agents. The relevant architecture and connection model are described in Portal Integration and Agent Connector.
When an orchestration platform is the right abstraction
- Mixed devices share an operational outcome. Cameras, sensors, and controllers must contribute to the same event or operator workflow.
- Raw data should remain local. The system needs local recording, buffering, or a controlled export boundary rather than continuous cloud transfer.
- Domain logic already exists. A team has a Python, C++, CUDA, PLC gateway, or other specialist component and needs the surrounding operational layer rather than a replacement for its algorithm.
- Sites must be independent but visible together. Each location requires local autonomy while a central team needs consistent health, configuration, and event visibility.
- Automation must be accountable. Actions need to be expressed as rules, logged as events, and linked to the system state that caused them.
Banalytics is not intended to replace a general-purpose container scheduler, a complete enterprise PSIM, or every vertical protocol gateway. It is most effective as the edge operating layer around connected physical systems: close enough to hardware to act reliably, but structured enough to integrate with the broader estate.
Start with an operational contract
- Define the equipment boundary. List the devices, protocols, local storage requirement, expected data rates, and who owns each connection.
- Define the event contract. Specify which conditions produce an event, the required metadata, severity, retention, and the consumers that need it.
- Place processing deliberately. Keep acquisition and safety-critical response local; place training, long-term aggregation, or enterprise workflows where their latency and data-governance requirements allow.
- Design recovery before scale-out. Decide how tasks restart, what happens when storage is constrained, and how a site reports degraded health.
- Prove one representative path. Validate an end-to-end sequence from device input through event and action to the operator or downstream system, then replicate that pattern.
This approach avoids a common failure mode in edge projects: building an impressive data path that cannot be operated safely once it leaves the lab.