Edge infrastructure for industrial sensing & instrumentation

Turn cameras, DAQ, sensors, and PLCs into an observable sensing system.

Turn a working sensing prototype into an operable edge system. Synchronize cameras, DAQ, sensors, and PLCs, run your existing processing, and add health monitoring, local evidence, dashboards, and integrations.

Move from prototype to pilot Reduce custom integration work Diagnose failures remotely Keep operational evidence local
Field inputs
Cameras
DAQ
Sensors
PLCs
Banalytics sensing stack
AcquireSynchronizeOperate
Operational outputs
Dashboard
Events
SCADA & API

Keep raw measurement data local. Community installation and Portal registration require Internet access; acquisition, storage, and processing run on the Agent.

Choose how to start

Start with software. Validate with real hardware.

Evaluate the standard interfaces yourself, or scope a focused pilot around your acquisition hardware, processing boundary, and deployment constraints.

Explore independently

Community Edition

Install one free Agent on an industrial PC or workstation. Explore cameras, MQTT/Modbus data, local storage, dashboards, events, and custom processing interfaces.

Community — Free · Basic — $15/month · Pro — $50/month
Deploy with your organisation

Pilot & Enterprise

Connect representative cameras, DAQ, sensors, or PLCs; validate synchronized data flow and processing integration; then harden lifecycle, monitoring, and recovery for deployment.

Pilot Project · Enterprise Deployment
Move from test bench to deployment without replacing your sensing IP.
Building a product or managed service? Explore a Technology Partnership →
Industrial sensing in practice

See the operational layers around acquisition and processing.

Explore industrial telemetry, device configuration, sensing architecture, custom processing, edge runtime, distributed Agents, and event history in one working environment.

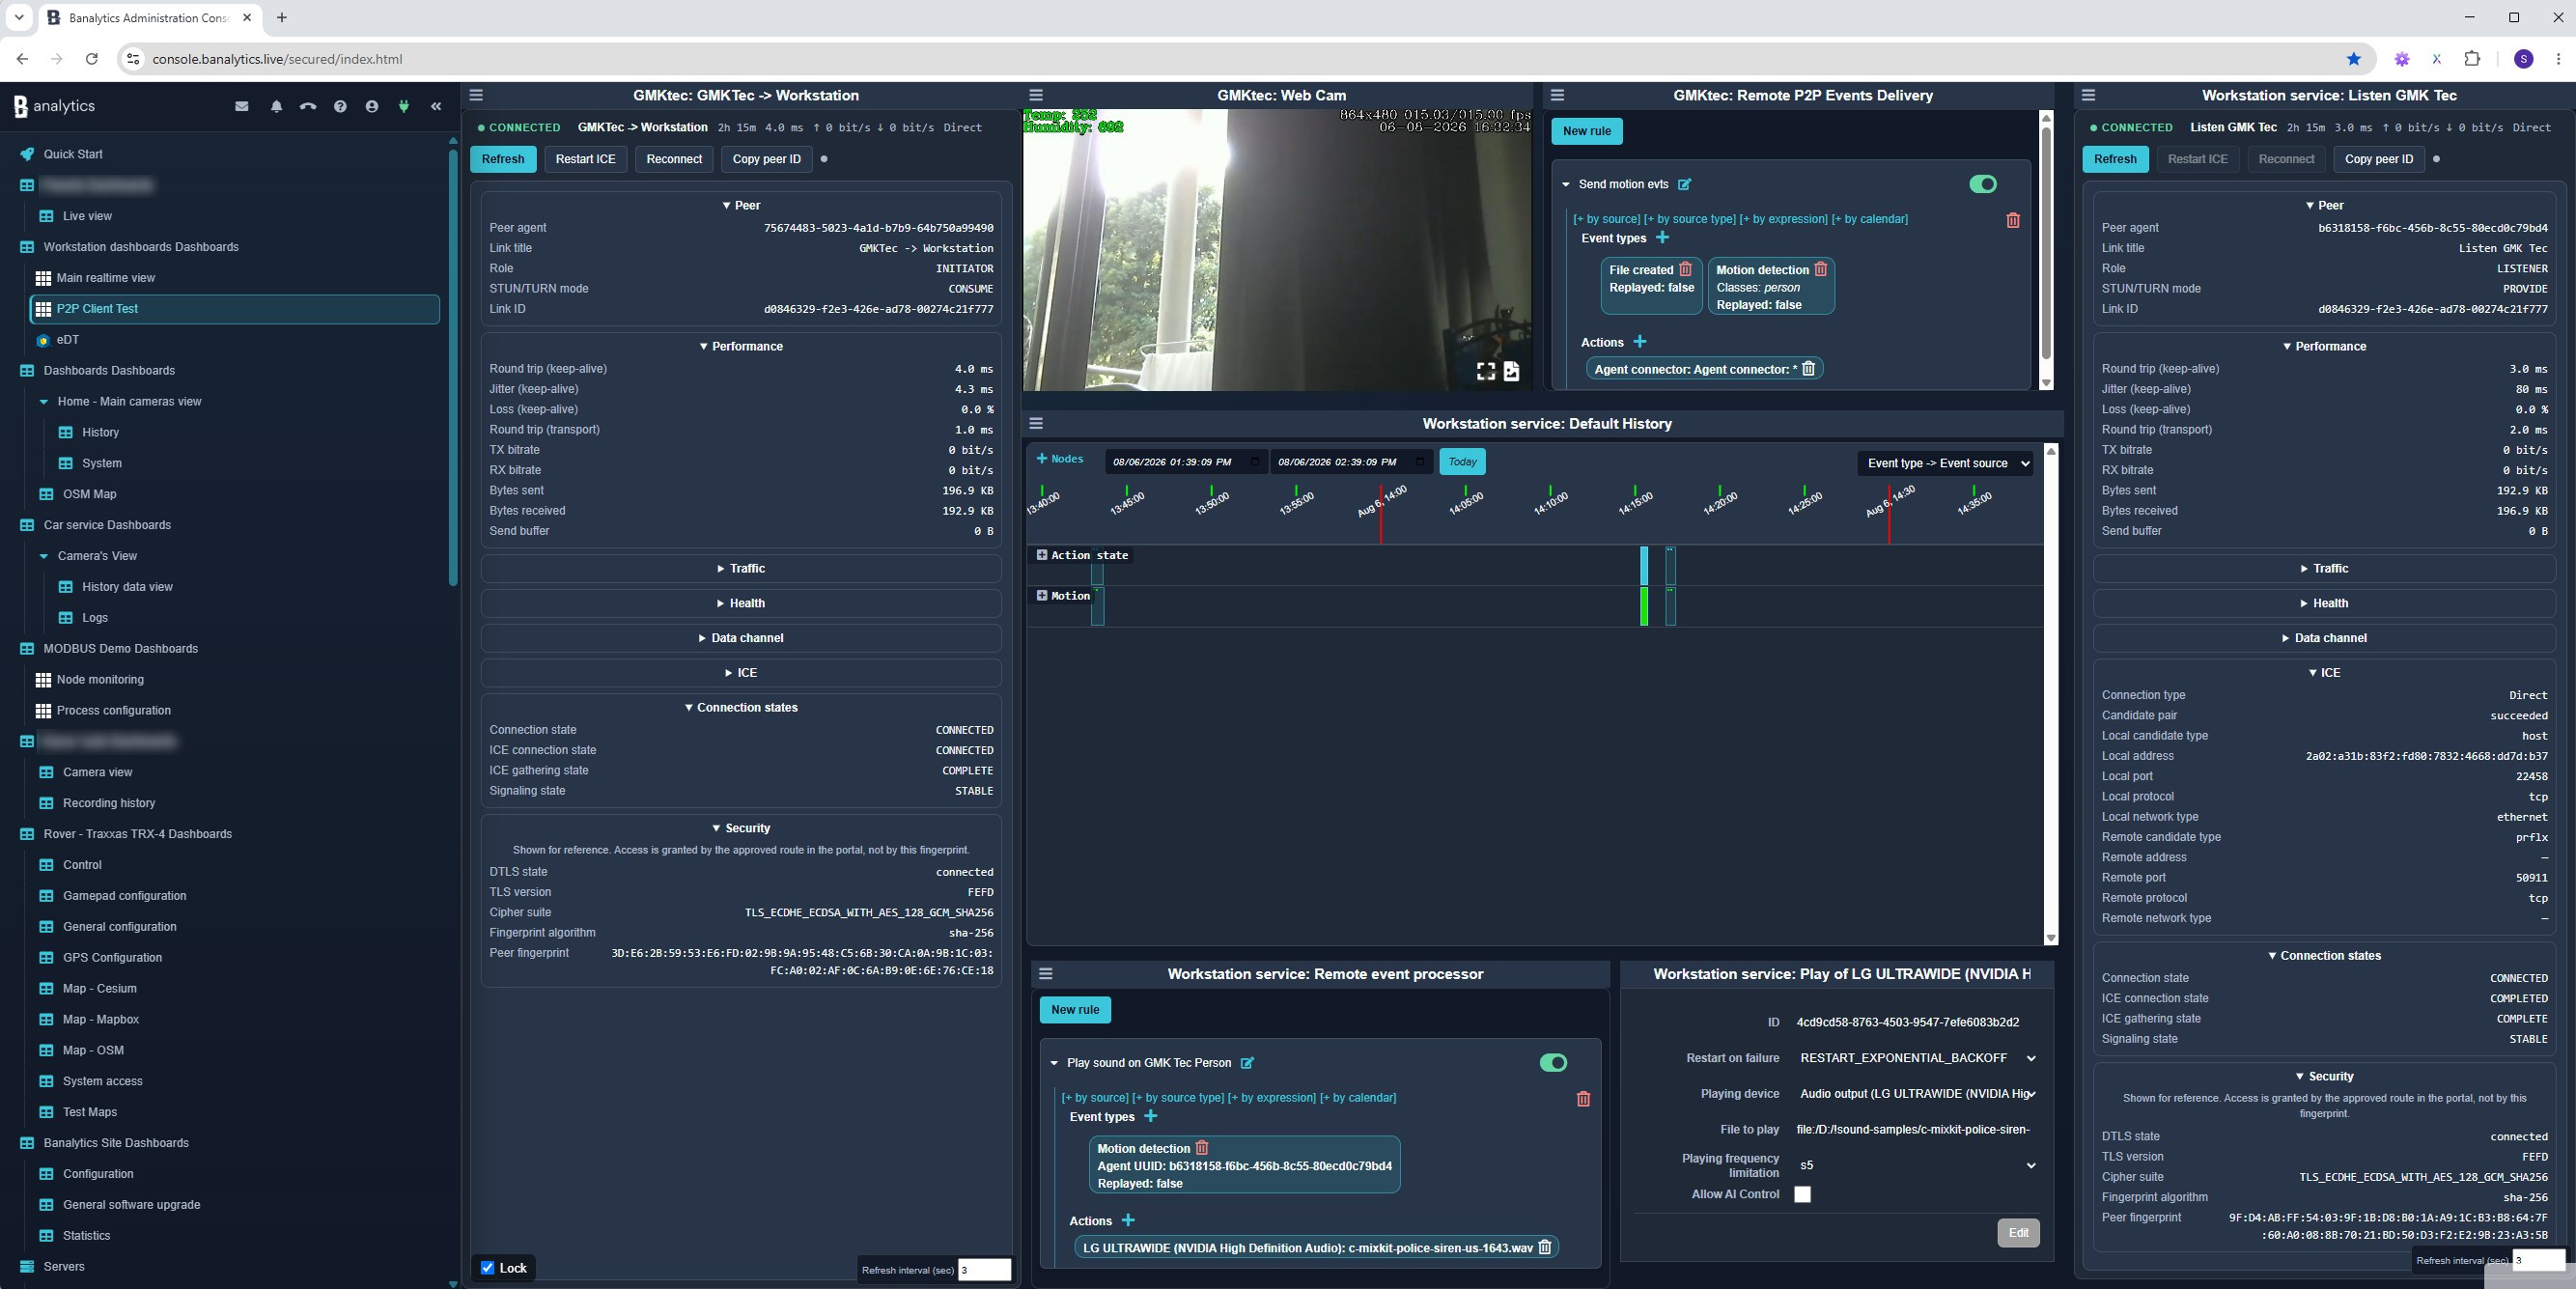
Industrial Modbus monitoring dashboard with live telemetry and system status
Modbus monitoringLive industrial telemetry, device state, and system health in one operational view.
Banalytics Modbus monitoring configuration workspace
Modbus configurationConfigure industrial telemetry and equipment state around the interfaces you already operate.
Banalytics sensing architecture from field devices to external systems
Industrial sensing architectureConnect acquisition, independent processing, orchestration, and downstream consumers.
Physical hardware integrated with Python machine learning and the Banalytics Java runtime
Python, ML & Java integrationKeep specialised processing independent while Banalytics manages the surrounding data flow and hardware.
Banalytics edge server configuration screen
Edge runtime configurationConfigure the local runtime, services, and operating boundary on industrial edge hardware.
WebRTC peer-to-peer network between distributed Banalytics Agents
Distributed sensing AgentsConnect autonomous edge environments through a controlled Agent-to-Agent topology.
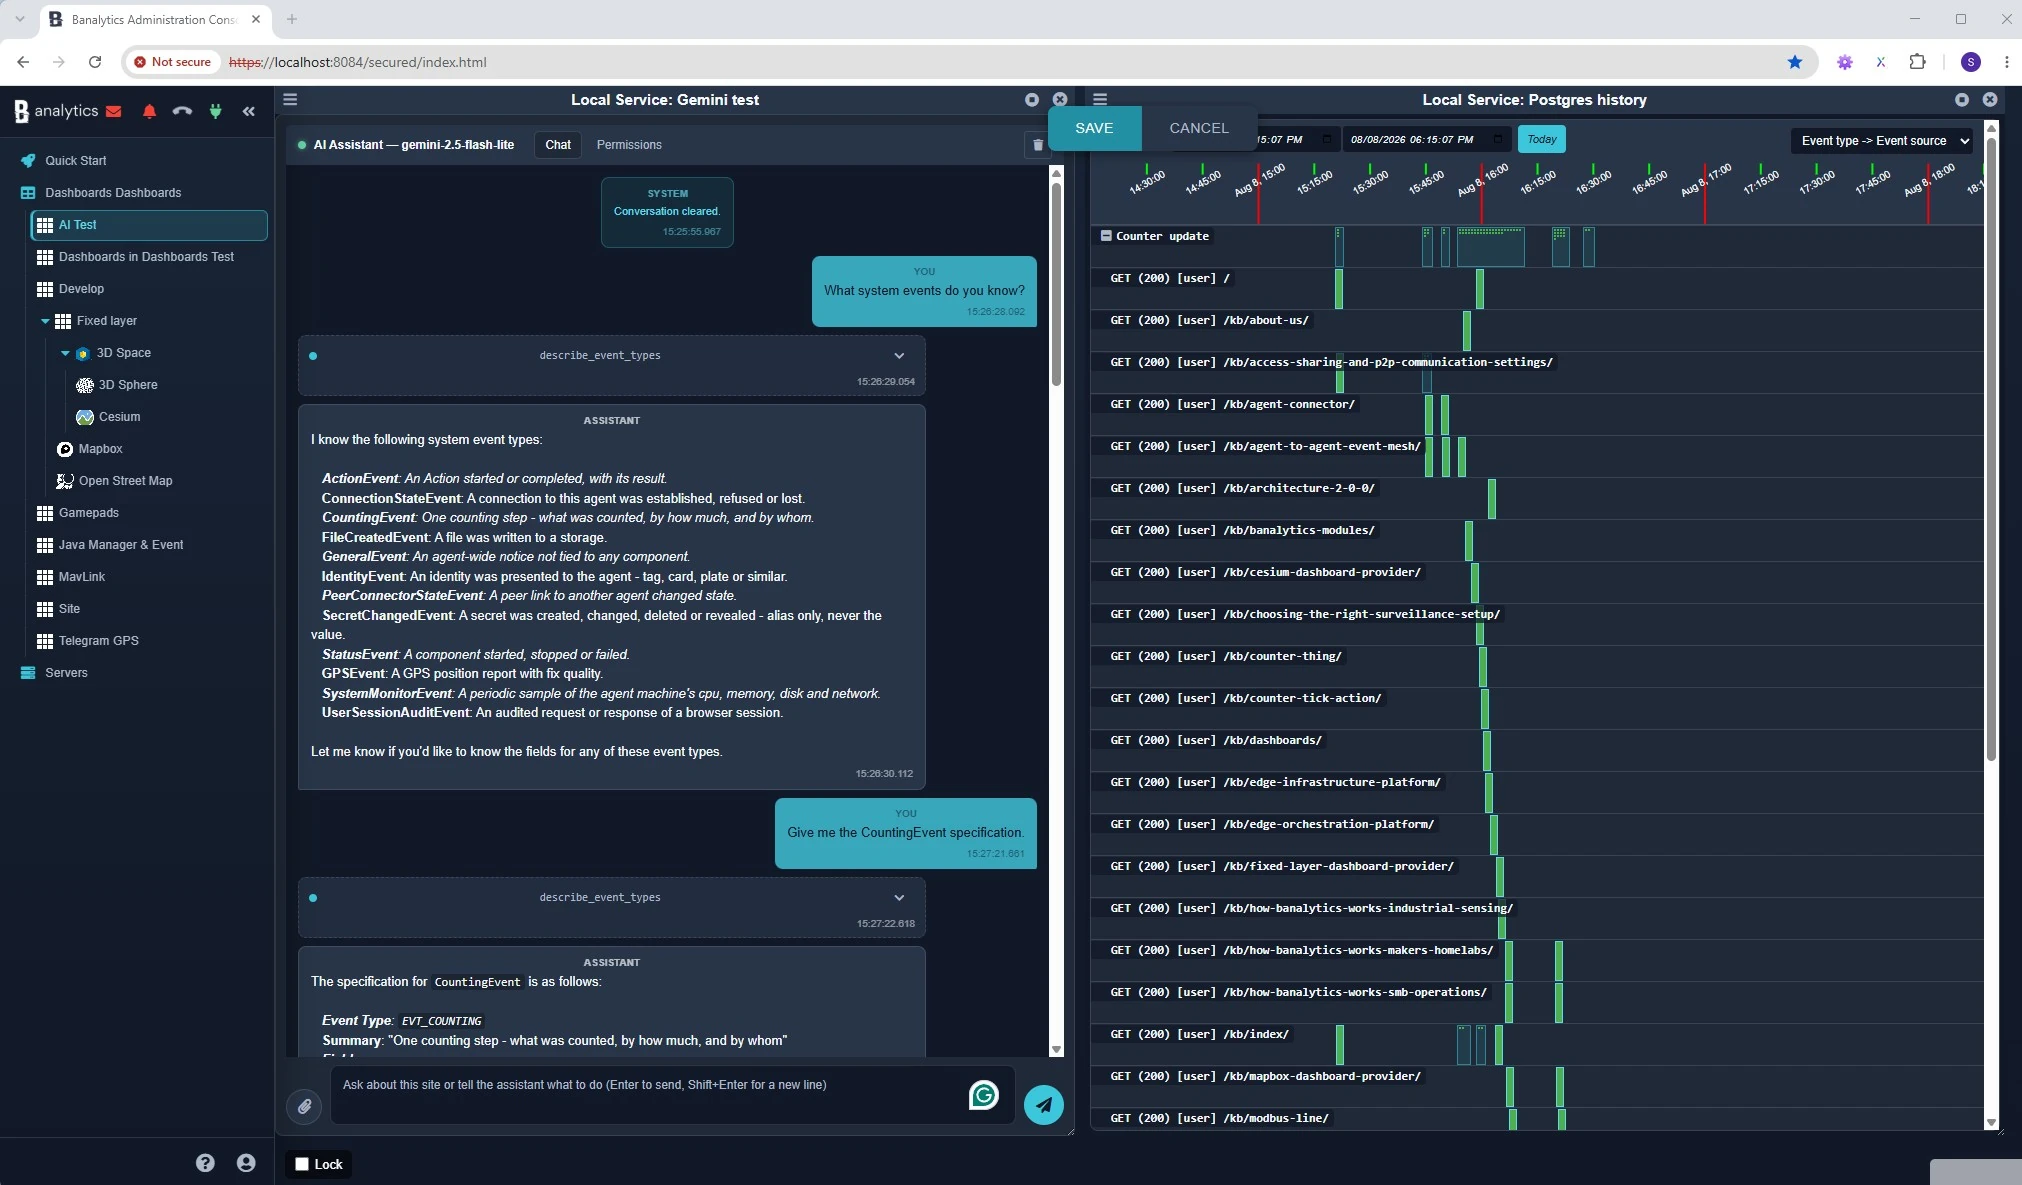
Banalytics event types and operational history workspace
Event types & operational historyRetain structured sensing outcomes and review the evidence behind operational events.
How it works

Acquire. Process. Operationalize.

Reuse the field hardware and sensing logic that already work, then add the operational layer needed to deploy, support, and integrate the complete system.

01

Acquire

Connect cameras, DAQ, sensors, and PLC state; handle buffering, triggers, timestamps, synchronization, and local retention.

ONVIF · RTSP · USB · vendor SDK · DAQ · Modbus
02

Process

Deliver raw inputs to your independent algorithms and receive structured results through an explicit processing contract.

C++ · CUDA · Python · Java · native OS · ZeroMQ
03

Operationalize

Supervise lifecycle and health, retain evidence, visualize state, automate responses, and publish selected outcomes.

Dashboards · Events · Historian · MQTT · REST · SCADA

Shorter path to a pilot

Reuse existing devices and processing modules instead of rebuilding the sensing stack around a new platform.

Remote diagnosis

See device health, processing state, events, and retained evidence without making every investigation an on-site task.

Controlled integration

Keep raw data and processing IP local while sharing selected results with MQTT, APIs, SCADA, historians, or AI pipelines.

The use case

Built for industrial sensing systems moving beyond the lab.

Use Banalytics when the sensing principle works, but deployment still needs reliable acquisition, observability, evidence, remote support, and integration.

Run it on your hardware

Start on the edge computer already beside your system.

Install Banalytics on a Windows workstation, Linux server, industrial PC, or ARM64 device, then connect representative sensing interfaces.

Pricing & adoption

Start free, then scale when the system is ready.

Community, Basic, and Pro use the same platform; the paid plans reduce component pricing. Pilot and Enterprise work is scoped separately around your hardware, integrations, and deployment requirements.

CommunityFreeOne Agent for personal use and product evaluation.
Basic$15/month · 30% offReduces the price of paid component instances.
Pro$50/month · 50% offFor larger self-service, multi-component infrastructure.
Pilot & EnterpriseScoped separatelyHardware integration, deployment, support, and agreed production scope.
Your first useful outcome

Make one real sensing path observable end to end.

Start with a standard interface yourself, or bring us your device list, data rates, processing boundary, and deployment constraints.