Machine Monitoring Software
Turn signals from machines into local operational state, evidence, and timely action.
Machine monitoring is not a screen full of tags. It is the engineering discipline of collecting trustworthy machine signals, attaching them to an operating context, detecting conditions that matter, retaining the evidence, and directing the result to the people or systems that can act on it. Edge software is valuable here because it keeps the acquisition and first response close to the machine.
What machine monitoring software must do
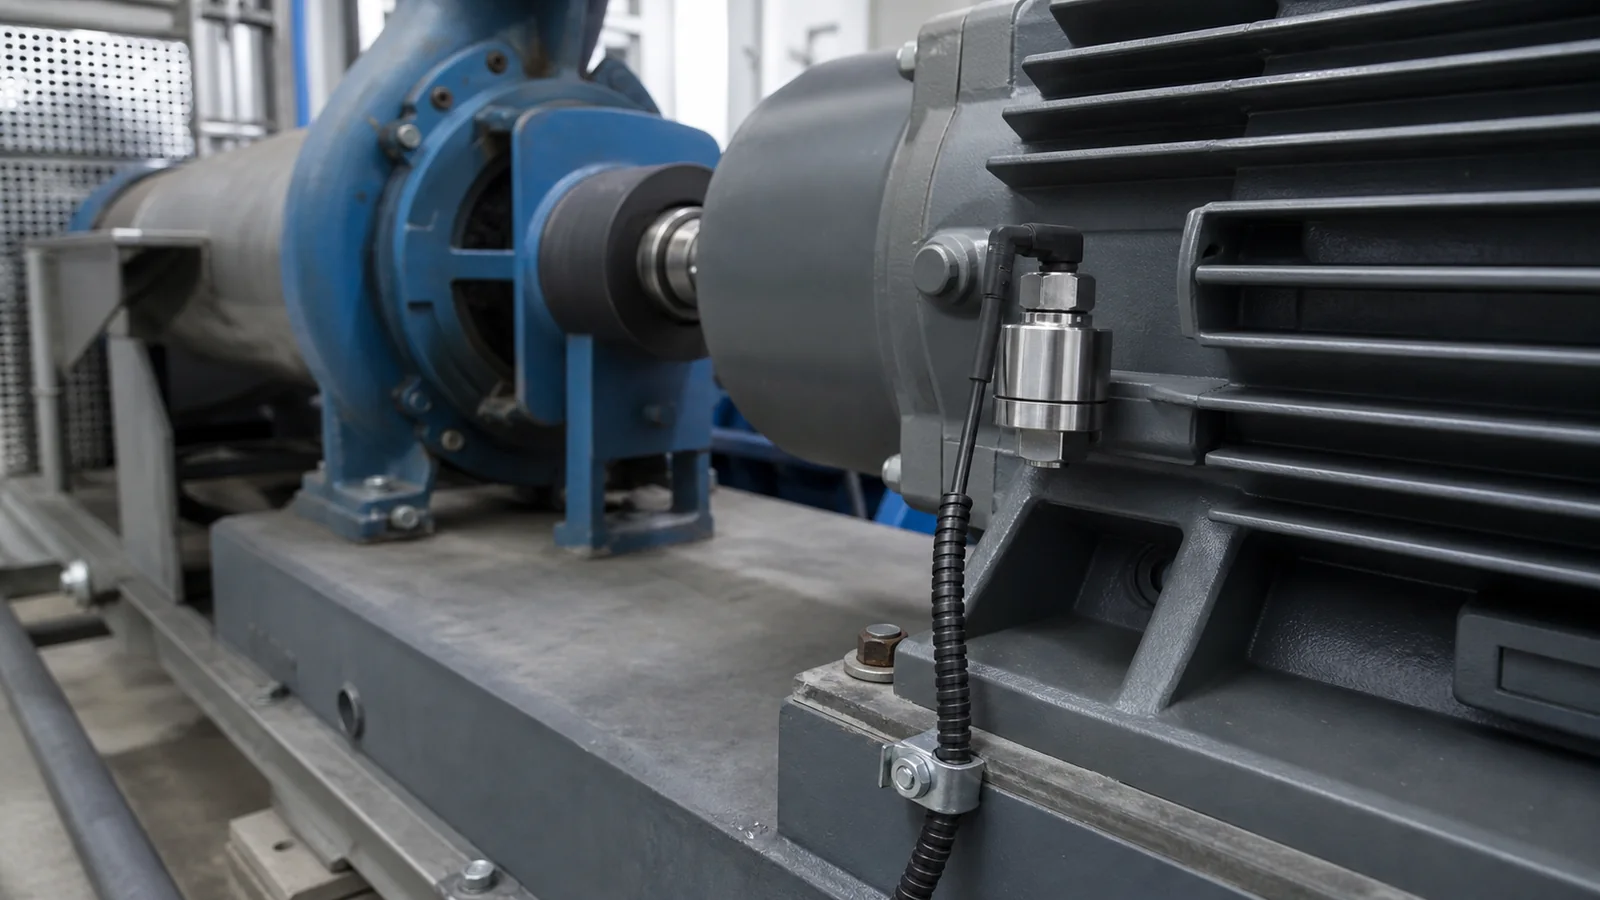
Machine monitoring software observes the condition and activity of a physical asset-for example, a pump, compressor, conveyor, packaging machine, robot cell, press, or test rig-then converts its signals into a usable operating picture. Depending on the equipment, inputs may include PLC registers, discrete alarms, energy values, cycle counters, vibrations, acoustic data, camera streams, operator inputs, or messages from a device gateway.
Useful monitoring begins before analytics. A register must have a known meaning; an alarm must be connected to the right machine and operating mode; a camera observation must be tied to a zone or process state; and a missing signal must not be mistaken for a healthy one. The objective is a trustworthy local model of what the machine is doing, not a larger collection of raw data.
Banalytics provides the edge operating layer around that model: local device connectivity, tasks and processing modules, event rules and actions, retention, dashboards, and controlled integration. It can host the operational system around a specialist algorithm or plant application; it does not claim to replace a machine’s PLC, safety system, CMMS, or every vendor-specific historian.
Start with machine state, not data volume
The best monitoring designs express a small number of meaningful states and transitions. A machine may be stopped, starting, running, starved, blocked, in alarm, in maintenance, or unknown. The source values needed to establish those states differ by asset, but the operational questions are consistent: what is happening now, what changed, how long did it last, and who needs to know?
| Signal category | Examples | Monitoring question |
|---|---|---|
| Machine and process state | Run command, feedback, mode, cycle count, recipe, alarm bit, interlock. | Is the machine producing, waiting, faulted, or deliberately unavailable? |
| Condition and performance | Temperature, pressure, current, power, speed, vibration, acoustic level, quality value. | Is operation within the expected envelope, and is the condition changing? |
| Material and flow | Level, position, part count, photoeye, weight, conveyor occupancy, valve state. | Is the machine supplied, processing, and releasing material as intended? |
| Visual or contextual evidence | Camera stream, image detection, operator input, work-order reference, location. | What was occurring around the machine when the event happened? |
| Connectivity and data quality | Last poll, communication error, stale timestamp, missing source, gateway status. | Can the reported state be trusted, or has the measurement path degraded? |
Do not infer a production result from one tag when the real process needs several conditions. For example, a motor current may show that a drive is energised; it does not prove that material was processed correctly. Establish the intended state model with process owners, then design the event logic around that agreement.
Put the first data path beside the equipment
Machine data is often produced on a plant network with practical constraints: legacy controllers, shared RS485 lines, limited outbound connectivity, variable device response times, and maintenance windows that do not align with IT release cycles. An edge node can acquire and interpret that data locally, then publish the selected result upstream without requiring every poll, frame, or measurement to traverse a remote service first.
For register-based equipment, Modbus Line manages serial, TCP, UDP, and RTU-over-TCP communication for one or more devices, including per-device polling, state tracking, errors, and state-change events. Its discovery functions are appropriate for commissioning with care: register discovery can touch equipment, so a production map should be curated from confirmed addresses rather than treated as an automatic truth source.
For message-driven systems, the embedded MQTT Server can act as a local broker near the equipment. It is useful where controllers, sensors, gateways, scripts, and Banalytics components need a shared local message path. Bind and secure it according to who can reach the node; anonymous access is only appropriate for loopback, an isolated lab, or another explicitly trusted network boundary.
Separate acquisition, interpretation, and response
Machine-monitoring projects become difficult to maintain when protocol handling, domain logic, dashboards, and notifications are merged into one opaque application. A better pattern separates the acquisition layer, an independent processing or analytics module, and the operational layer that turns results into retained state and actions.

In this arrangement, a vibration model, acoustic classifier, image-processing service, or custom process can remain focused on its domain result. Banalytics handles surrounding operational concerns: device connectivity, buffering, task lifecycle, local files, event rules, dashboards, remote access, and structured delivery to other systems. The engineering boundary is described in How Banalytics Works for Industrial Sensing.
Make conditions actionable without over-automating the plant
A condition becomes an operational event when it has a defined meaning, severity, persistence rule, and response. A high temperature for one sample may be diagnostic noise; a sustained high temperature while a machine is running may be a maintenance condition; the same value while the machine is intentionally stopped may need no action at all. Event logic must include this operating context.
Banalytics uses its Event Manager to evaluate incoming events and initiate configured actions. The action can notify an operator, write to an external system, publish a message, record evidence, invoke a custom integration, or change the state of a local task. The appropriate response depends on plant authority: an edge monitoring system can support decisions and controlled automation, but it should not be treated as a substitute for independently engineered safety functions.
| Condition | Useful rule design | Typical first response |
|---|---|---|
| Communication loss or stale source | Distinguish a missing measurement from a normal stopped state; apply a timeout. | Create a data-quality event and direct troubleshooting to the connection owner. |
| Threshold excursion | Require a defined duration or repeat count; include machine mode where relevant. | Notify, retain the event, and provide the source values or visual context. |
| Unexpected state transition | Model the permitted sequence, not only the destination state. | Record the transition and route it to the responsible line or maintenance role. |
| Quality or anomaly result | Keep confidence, source, time, and input context attached to the result. | Escalate for review, publish a structured event, or trigger a controlled downstream workflow. |
| Repeated equipment fault | Group or rate-limit repeated events so the symptom remains visible without flooding users. | Open an investigation path and retain a concise history of occurrences. |
Retain the evidence needed to explain a machine event
A machine event is more valuable when an engineer can reconstruct it later. Record the transition, the input values that established it, the duration where applicable, the associated action, and any context that is safe and useful to retain. Selective history is usually better than unlimited raw retention: it preserves diagnostic value without turning every monitoring deployment into an uncontrolled data archive.
The Event History Recorder can retain selected events for review. Dashboards should then serve the distinct needs of different users: maintenance may need recent alarms and condition trends; production may need current state and stoppage context; engineering may need signal integrity and detailed transitions. When a standard view does not fit, D3JS Charts can visualise data obtained through polling, Remote API calls, forwarded events, or a historical load followed by real-time updates.
Keep machine health separate from edge-node health. A stalled conveyor and a node with low disk space are different incidents, even if both appear in the same operational console. The System Monitor provides the runtime health signals for the local Agent; machine monitoring should use its own data sources and state model.
Commission one machine before standardising a line
- Choose a bounded machine outcome. Start with a specific question: availability state, recurring fault evidence, condition threshold, cycle integrity, or a selected quality check.
- Confirm the signal contract at the machine. Verify addresses, units, update rates, alarm semantics, timestamps, and the meaning of unavailable data with the equipment owner.
- Build the local state model. Define normal, abnormal, maintenance, and unknown states before constructing dashboards or alerts.
- Prove the event path. Test a representative transition from device input through local interpretation, retained evidence, action, and any external delivery.
- Review false positives and missing context. Tune persistence and context rules with operators before expanding automation or replication.
- Replicate the operating contract. Reuse the validated pattern for similar machines, changing only the confirmed machine-specific map and domain logic.
Effective machine monitoring software does not promise to make every asset intelligent overnight. It establishes a reliable edge foundation on which maintenance, production, and engineering teams can make better decisions from the evidence their machines already produce.