Smart City Edge
Local intelligence for distributed public infrastructure, with data and operations kept close to each site.
A smart-city program succeeds when many small physical systems can be operated reliably without creating one uncontrolled central data dependency. Edge computing gives each intersection, building, utility enclosure, public space, or remote facility a local operating boundary. It processes the information that must remain nearby and shares only the outcomes that other teams need.

Urban infrastructure is distributed by nature
Public infrastructure is rarely one system. It is a collection of independently owned and maintained assets: cameras, environmental sensors, building controls, pumps, meters, lighting cabinets, transit facilities, parking systems, and local networks. They operate in different neighbourhoods, have different service windows, and generate data with different operational and privacy implications.
A smart-city edge architecture establishes a repeatable local pattern for these assets. The node at a site connects to equipment, runs the local workload, retains data or evidence where required, monitors its own health, and creates events with enough context for a municipal team or external system to act. The central layer then receives a selected, governed representation of what occurred rather than becoming the mandatory route for every raw signal.
This is not an argument for a single city-wide platform to control every subsystem. It is an argument for clear boundaries: each domain keeps the authority and safety controls it requires, while shared infrastructure exposes well-defined information and operational workflows across the estate.
For the same local-first approach applied to towns and settlements with small budgets, limited technical staff, and community-supported observation points, see Edge Solution for Small Cities.
Design each site as an autonomous local system
| Layer | Responsibility | Examples |
|---|---|---|
| Field assets | Generate measurements, media, state, or control signals. | Cameras, meters, PLC gateways, sensors, access systems, relays, local controllers. |
| Site edge node | Acquire data, execute local tasks, apply bounded rules, store evidence, and report local health. | Industrial PC, server, or ARM device running a Banalytics Agent close to the assets. |
| Site or domain integration | Exchange selected events and measurements with local services or domain systems. | MQTT, Modbus, ZeroMQ, APIs, files, databases, or a specialist gateway. |
| Shared operations layer | Give authorised users visibility into participating sites, configurations, events, and diagnostics. | Browser access, dashboards, event history, remote support, and multi-site operational views. |
| External consumers | Use approved contextual outputs for reporting, maintenance, public-service workflows, or analytics. | Domain applications, city data platforms, service contractors, and governance-approved systems. |
The site edge node should own the local critical path. If the upstream connection is interrupted, a camera should continue its locally configured recording, a local device connection should continue its intended polling, and a site rule should continue to evaluate inputs within its authorised scope. Central visibility can pause temporarily without turning a local operating event into a loss of service.
Start with local outcomes, not a city-wide data lake
| Infrastructure domain | Local edge responsibility | Useful upstream outcome |
|---|---|---|
| Public-space observation | Acquire camera streams, retain configured evidence locally, run permitted local detection or event workflows. | Selected events, status, approved clips or references, and maintenance diagnostics. |
| Building and facility operations | Read local device state, evaluate site conditions, and provide a local operator view. | Equipment-state changes, alarms, consumption summaries, and work requests. |
| Environmental and utility monitoring | Poll sensors or gateways, validate data freshness, retain local measurements, and flag threshold or communication conditions. | Time-stamped measurements, data-quality events, and aggregated status. |
| Mobility and transit sites | Collect approved local signals and visual context; keep time-sensitive workflow logic near the site or domain controller. | Structured incident, occupancy, or equipment-status events for authorised systems. |
| Distributed municipal facilities | Operate site-specific devices and media workloads independently while exposing health and configuration for support. | Multi-site operational visibility, selected alerts, and capacity information. |
These are architectural patterns, not a claim that every city protocol or domain system is implemented natively. Where a project relies on a proprietary controller, specialised traffic system, utility gateway, or vertical application, treat it as an explicit integration boundary with a documented owner and failure behaviour.
Make data minimisation an architectural property
Urban data can be operationally sensitive even when it is not personally identifiable. Raw video, detailed movement data, facility access state, and high-resolution measurements may have a different retention and sharing policy from a maintenance event or a daily count. The edge is a useful enforcement point because it can keep raw data near the source and publish a smaller, purpose-built output to a defined consumer.
- Define the purpose before collecting. Link every source to a documented operational decision, maintenance need, or public-service outcome.
- Separate raw inputs from derived outputs. Do not export a continuous stream when a threshold event, aggregate, or approved reference meets the downstream need.
- Keep retention explicit. Assign the storage location, duration, cleanup rule, access scope, and evidence requirements for every retained data type.
- Preserve provenance. A downstream event should retain source, time, site, confidence or quality, and the rule or process that produced it.
- Review external access as an integration. A dashboard, API, contractor workflow, or analytics feed needs its own authorised scope and operational owner.
Technical controls support governance; they do not replace legal, policy, privacy, procurement, or public-accountability processes. Those requirements should be set by the responsible public authority and reflected in each site’s data contract.
Central visibility must not centralise every workload
City estates need a practical way to operate numerous sites without forcing them into a single execution point. A repair team may need to see which nodes have low disk capacity; a domain operator may need current events from a set of facilities; a central team may need to verify that a configuration change reached its intended environment. None of these needs requires raw data from every site to be continuously transported to one server.

Banalytics Agents run independently at each location. Portal Integration uses a WebSocket signalling channel so an authorised browser can establish a peer-to-peer WebRTC session with an Agent for remote access, media, files, and shared operations. This supports remote management without placing the portal in the local acquisition path. See Portal Integration and How Banalytics Works for Multi-Site Operations.
Place analytical context where the asset is
A city operator should not have to translate an alarm into a location by hand. A geospatial dashboard makes location part of the operational context: an operator can see an asset, the analytical components associated with it, its most recent state, and the surrounding area in one view. This is particularly useful when the estate includes many dispersed facilities, moving equipment, or a mixture of public-space and back-office assets.
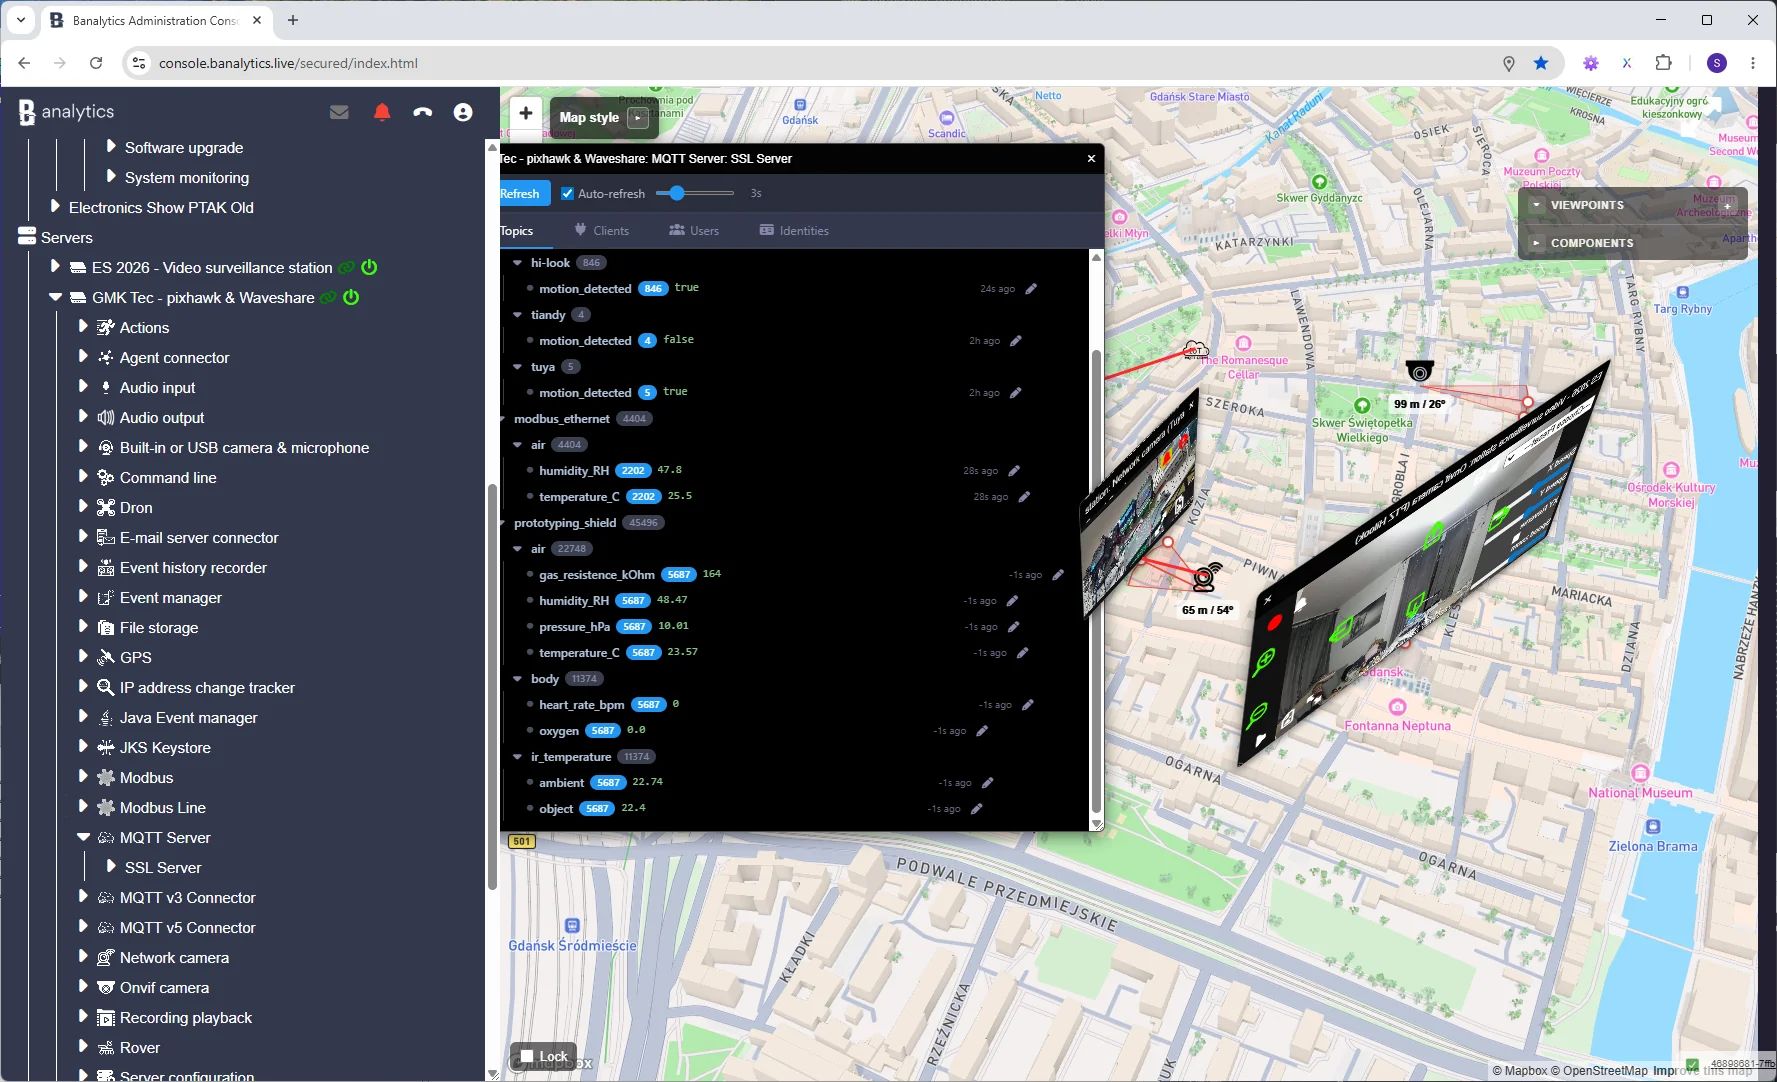
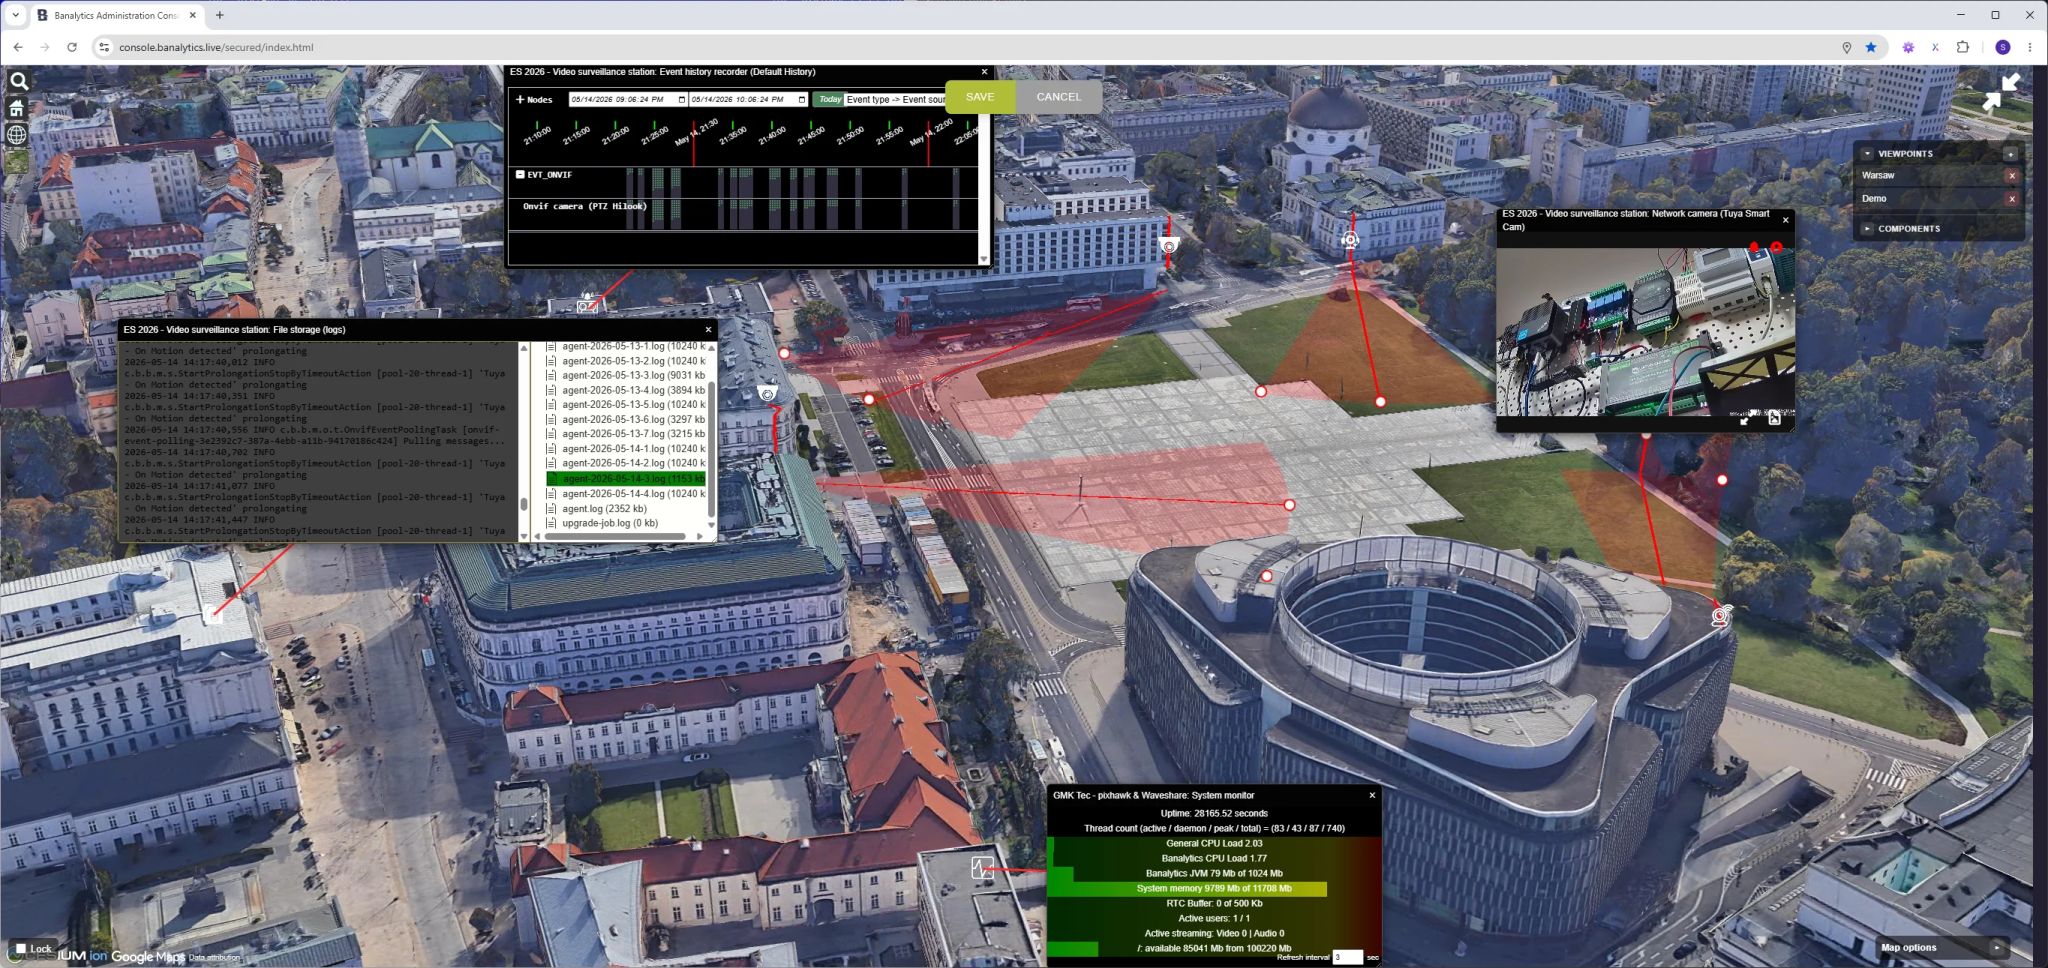
In Banalytics 2.0, dashboards are owned by the Agent. Their hierarchy, pages, access rules, and provider configuration are held with the Agent rather than treated as a detached cloud-only screen. The portal provides the editor and viewer, while a dashboard-provider module supplies the visual surface. This lets a deployment select the geographic view that is appropriate for the operational question: a 2D local map, a vector-map dashboard, or a navigable 3D globe. See Dashboards and Dashboard Hierarchy for the operating model.
| Dashboard surface | Operational use | What should be configured deliberately |
|---|---|---|
| OpenStreetMap Dashboard Provider | Local operational maps, site clusters, service areas, and location-aware status views. | Tile-server endpoint, coordinate reference, zoom range, display rules, and access to the underlying asset data. |
| Mapbox Dashboard Provider | Vector-map dashboards where a project needs a styled basemap and location-specific operational layers. | Map style, token handling, permitted map service, layer semantics, and the refresh behaviour of the analytical data. |
| Cesium Dashboard Provider | 3D geographic context for distributed assets, terrain-aware operations, or a wider operational area. | Cesium Ion credentials where used, imagery and terrain sources, camera presets, and the meaning of any 3D markers or layers. |
Map pages can combine geographically anchored asset markers with the analytical information that gives those markers meaning: an alert state, a threshold breach, a camera or sensor result, capacity information, or a current health indicator. A provider-specific map supplies the geographic context; dashboard components and event/API integrations supply the values. Purpose-built visualisations can also be delivered through the D3.js component when a project needs a specialised operational graphic rather than a standard map layer.
Show a mobile Agent as a live operational entity
The same pattern applies to an Agent installed on a vehicle, drone, or robot. If the platform or its GPS integration publishes coordinates, the dashboard can visualise the Agent’s latest reported geographic position alongside the telemetry and analytics relevant to that mission. The point on the map is then not merely a moving icon: it is an entry point to the device’s state, generated events, connectivity, and assigned operational workflow.
| Entity on the dashboard | Geographic data | Analytical context at that location |
|---|---|---|
| Fixed municipal asset | Configured site or asset coordinates, service area, and optional local boundary. | Current equipment state, environmental measurements, alarms, maintenance status, and recent local events. |
| Vehicle-mounted Agent | Latest latitude and longitude from the vehicle or connected positioning source; direction and route history where those fields are retained and published. | Mission state, communications health, sensor or camera analytics, and exceptions that need dispatcher attention. |
| Drone or robot Agent | Latest position from the platform integration; altitude, heading, or planned path only when supplied by the source and authorised for display. | Task progress, inspection observations, detection events, battery or platform health, and operator intervention state. |
The Rover integration, for example, can publish a geographic-position event from its GPS information; Banalytics also supports dedicated rover and drone control workflows. Other mobile platforms require an equivalent device or integration feed; a dashboard renders reported coordinates, it does not create them. For every moving object, distinguish the latest position from a current position: retain the event timestamp, mark stale telemetry visibly, and show a track only when the retention and disclosure policy permits it. This avoids presenting an old coordinate as a live operational fact.
Geolocation deserves the same governance as other sensitive operational data. Limit who can see live positions, define how long tracks are retained, separate public map imagery from protected asset attributes, and protect any third-party map credentials. For the supporting node-health view, Banalytics System Monitor exposes the CPU, memory, storage, thread, media, and connection metrics needed to determine whether the Agent that reported a position is itself operating normally.
Use protocol boundaries that fit the site
A smart-infrastructure deployment often contains both older field equipment and newer connected devices. The edge layer should connect directly where the protocol is appropriate, and it should provide a controlled handoff where a domain gateway or proprietary service is required. Banalytics supports common local patterns for cameras, Modbus equipment, MQTT devices, ZeroMQ services, files, and custom processes.
The Modbus Line component supports serial and network variants, multi-device polling, device state tracking, and event generation. The embedded MQTT Server can provide a local publish/subscribe path for devices, gateways, and applications, with authentication and transport options suitable for the deployment boundary. For custom local services, ZeroMQ Socket provides a low-latency messaging integration where both sides share the same contract.
Protocols are not a governance model. Every interface still needs defined ownership, message schema, authentication, rate limits, error behaviour, and an answer to what happens when the external consumer is unreachable.
Monitor the node as carefully as the asset
A distributed city deployment is only as reliable as its least observable sites. An edge node can appear reachable while storage is almost full, memory is under pressure, a device connection is stale, or remote preview traffic is accumulating. Site health should produce actionable signals before local data or service is lost.
Banalytics System Monitor publishes CPU, memory, disk, thread, media, WebRTC, and user-activity metrics as System state events. These can be displayed, retained, or used in Event Manager rules. Pair node-health events with the appropriate human response: disk capacity may need a retention review; a stale device needs connection diagnosis; a growing remote buffer needs network or client investigation. Avoid a single blanket restart action for conditions with different causes.
For functions with safety, regulatory, or emergency-service authority, the responsible dedicated system must retain its defined role. Banalytics should be positioned as an edge orchestration and observability layer around connected physical systems, not as a replacement for independently engineered safety controls or statutory command systems.
Scale from one accountable site pattern
- Choose one narrow public-service outcome. Start with a bounded facility, asset group, or operational question that has a clear owner and success measure.
- Document the site contract. Define devices, protocols, local processing, data retention, external consumers, access roles, health signals, and outage behaviour.
- Prove the local path. Test acquisition, processing, storage, event creation, and required site response while the upstream connection is unavailable.
- Prove the shared path. Verify the selected data package, remote access, dashboards, alerts, and external integration with their actual users.
- Harden operations. Establish update, recovery, credential, monitoring, and incident-handling procedures before adding further sites.
- Replicate the pattern deliberately. Reuse the contract where assets are comparable and document deviations where a domain or site requires a different boundary.
Smart-city edge computing is not about putting intelligence everywhere at once. It is about giving each connected public asset a supportable local operating model, then connecting those models through data contracts that respect operational responsibility and public trust.