Real-Time Edge Analytics
Turn local physical data into timely, contextualised operational outcomes without forcing every raw input through a remote service.
Real-time analytics is not defined by a fashionable latency number. It is defined by whether a result arrives early enough, with enough context and reliability, for a named operational decision. Edge computing makes that possible by keeping acquisition, processing, event creation, and the first response close to the physical source.
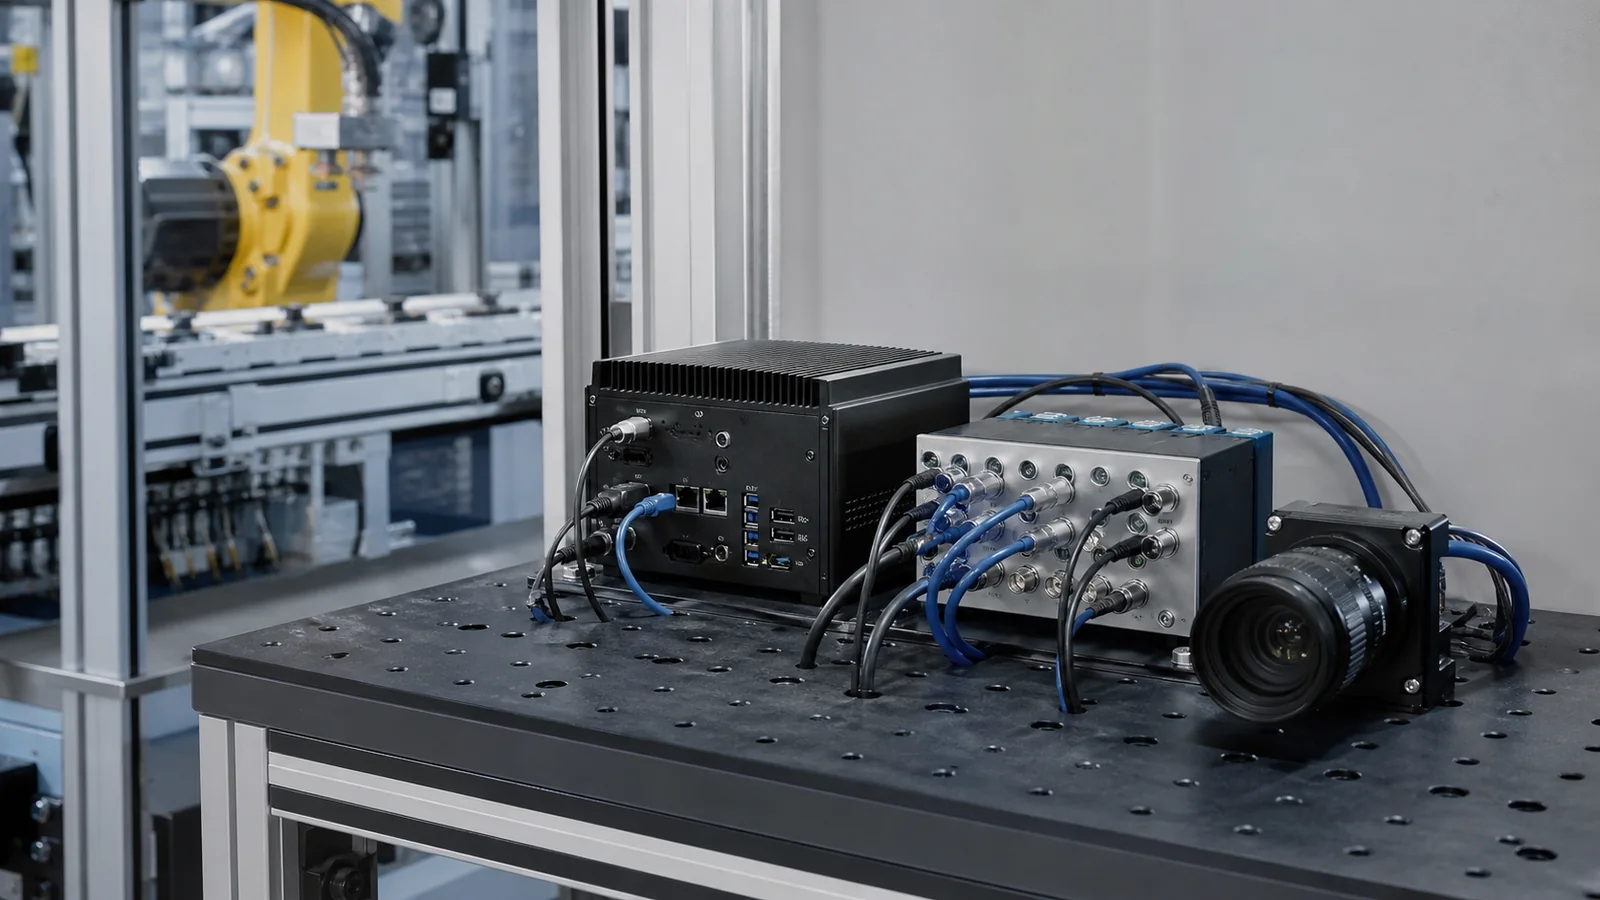
Define real time by the decision, not by the dashboard refresh
Real-time edge analytics acquires data near a physical asset, processes it locally or through a nearby specialist module, and produces a result within the time budget required by an operational workflow. That workflow may be an operator notification, a quality review, a maintenance response, a selected integration message, or a local observation retained for later analysis.
The time budget belongs to the use case. A visual quality indicator might need to be produced before an item leaves a station; a cold-chain excursion may need a rapid but not millisecond response; a daily energy summary can tolerate a much longer interval. The design must state the source rate, input window, processing duration, network allowance, event-delivery expectation, and the person or system that receives the result.
Do not confuse this with hard real-time control. Banalytics can support local observation, analytics, workflow, and controlled integration around physical systems. It is not a substitute for deterministically engineered PLC, motion-control, protection, safety, or other control loops that must meet certified or hard real-time guarantees.
Measure the complete path from source to useful outcome
| Stage | Question to answer | Typical evidence |
|---|---|---|
| Source acquisition | When was the measurement, frame, waveform, or message actually produced and received? | Source timestamp, capture rate, device clock, packet or frame loss, connection state. |
| Local preparation | How much time is spent buffering, decoding, normalising, windowing, or extracting features? | Input-window length, queue depth, dropped samples, preprocessing version, resource usage. |
| Analytics execution | How long does the model or calculation take under representative load? | Execution time, throughput, model version, result confidence, error state, accelerator or CPU utilisation where applicable. |
| Event orchestration | How quickly does a structured result become an operational event and selected action? | Event timestamp, rule evaluation, action queue state, action result, retained evidence reference. |
| Consumer delivery | When did the intended user or system receive enough information to act? | MQTT/API delivery state, dashboard update, notification time, acknowledgement, downstream error or retry status. |
A dashboard that refreshes quickly does not prove that the data is current. Preserve the original source time, the time the analytic result was produced, and the time it reached the consumer. This lets an operator distinguish a live process condition from a delayed, replayed, or stale observation.
Place high-volume inputs and specialist processing at the edge
Field devices produce raw inputs: cameras, DAQ hardware, acoustic streams, meters, controllers, sensors, or local services. Banalytics acquires and manages these sources on the local host. A specialist processing module performs domain-specific work where needed. Banalytics receives the structured result, adds operational context, creates events, retains configured records, and delivers the selected output to dashboards, MQTT, APIs, files, or another approved consumer.
This arrangement separates responsibilities. The processing team can improve a Python, native, C++/CUDA, or vendor module without rewriting device integration and operational workflows. The site team can change a sensor or event recipient without modifying model code. The detailed acquisition-to-orchestration path is described in How Banalytics Works for Industrial Sensing.
| Local responsibility | Banalytics role | Specialist module or external role |
|---|---|---|
| Device connectivity and source health | Connect components, maintain local state, retain configured data, and expose device or host health. | Provide device-specific capability only where a native protocol, SDK, or analytical requirement requires it. |
| Real-time analytical work | Manage the operational boundary, data contract, result lifecycle, and controlled handoff. | Perform feature extraction, inference, scoring, fusion, or calculation with declared performance limits. |
| Operational response | Create events, evaluate rules, retain evidence, update dashboards, and execute preconfigured actions. | Consume selected results only when an approved business, control, or analytical workflow needs them. |
Use the local path when waiting for the cloud changes the outcome
| Pattern | Local analytical work | Operational result |
|---|---|---|
| Visual inspection or observation | Acquire a camera stream, run permitted local detection or analysis, and retain configured evidence close to the source. | Selected condition event, quality review signal, evidence reference, or local operator indication. |
| Signal and waveform analytics | Buffer and process acoustic, vibration, electrical, or other measurement windows through a specialist module. | Feature, score, deviation, or classified result with source time and input-quality context. |
| Process and equipment monitoring | Combine fresh local sensor and controller state with a defined rule or calculation. | Time-bounded maintenance, quality, capacity, or operating exception for the responsible team. |
| Mobile or remote asset observation | Receive approved telemetry or media close to the vehicle, device, or local gateway; continue the local path through an imperfect uplink. | Latest valid state, selected mission or equipment event, and explicit indication when the source becomes stale. |
| Data capture for later learning | Trigger a local capture window around a relevant event and attach the measurements, source state, and metadata needed for training. | Structured sample package and controlled notification to a research or ML pipeline; raw archive remains at the edge unless the owner exports it. |
Make throughput, quality, and failure behaviour first-class requirements
A local analytical pipeline is only as useful as its contract. Document the source type, format, units, rate, timestamp, expected latency, input window, accepted loss behaviour, processing timeout, output schema, model version, confidence or quality fields, and retry or fallback behaviour. If any of these are unknown, the deployment cannot distinguish an analytic issue from a data-path failure.
For local module exchange, ZeroMQ Socket can provide an explicit low-latency messaging path where both sides share the same schema. Where publish/subscribe is appropriate, the embedded MQTT Server provides a local broker boundary and an MQTT Topic Listener turns a defined inbound message into a Banalytics event. Use the transport that suits the contract; do not use a protocol name as a substitute for a latency or reliability design.
Backpressure is an operating decision. When input arrives faster than processing can consume it, the project must decide whether to sample, batch, drop, retain locally, reduce fidelity, allocate more compute, or signal a degraded mode. Hiding an unbounded queue behind a dashboard makes a delayed result look real-time until the moment it matters.
Turn timely results into bounded, reviewable actions
Banalytics Event Manager evaluates configured events and invokes preconfigured actions. A rule can update a dashboard, retain evidence, notify a responsible team, publish a concise MQTT message, or call an approved integration. The event should retain source, source time, analytic result, quality, model or rule version, severity, evidence reference, and expected response owner. See Event Manager for the rule-and-action model.
Monitor the runtime as part of the latency budget. Banalytics System Monitor publishes CPU, memory, disk, thread, media, WebRTC, and user-activity state as System state events. A resource-constrained host, a slow model, full storage, a stale source, and a blocked external consumer are different reasons for a late result; each needs its own runbook.
Authorised remote users can access Agent context through Portal Integration without making the portal the mandatory path for local acquisition and analytics. This supports diagnostics and shared visibility while the time-sensitive pipeline remains inside the local operating boundary.
Use real-time edge analytics when the local result materially improves operations
- The decision has a documented time budget that would be compromised by first transporting all raw input to a remote service.
- Raw data is high-volume, confidential, costly to transport, or useful locally through an upstream outage.
- The recipient needs the source, timing, quality, and evidence context to act responsibly on the result.
- The project can measure the full latency budget and define degraded behaviour when processing or connectivity falls behind.
- Dedicated control and safety systems retain their authority for functions that require deterministic or certified response.
Real-time edge analytics is successful when a team can prove not just that a result is fast, but that it is timely, trustworthy, attributable, and usable by the person or system that owns the next decision.