Edge Monitoring Software
Make the health of local edge nodes visible before a resource issue becomes a data or operations incident.
Edge monitoring software must observe the machine, the runtime, the data path, and the operator-facing service as one operating system. CPU alone is not enough: a node can have spare CPU while a disk fills, native memory is exhausted, a stream backs up, or a remote viewer creates transport pressure.
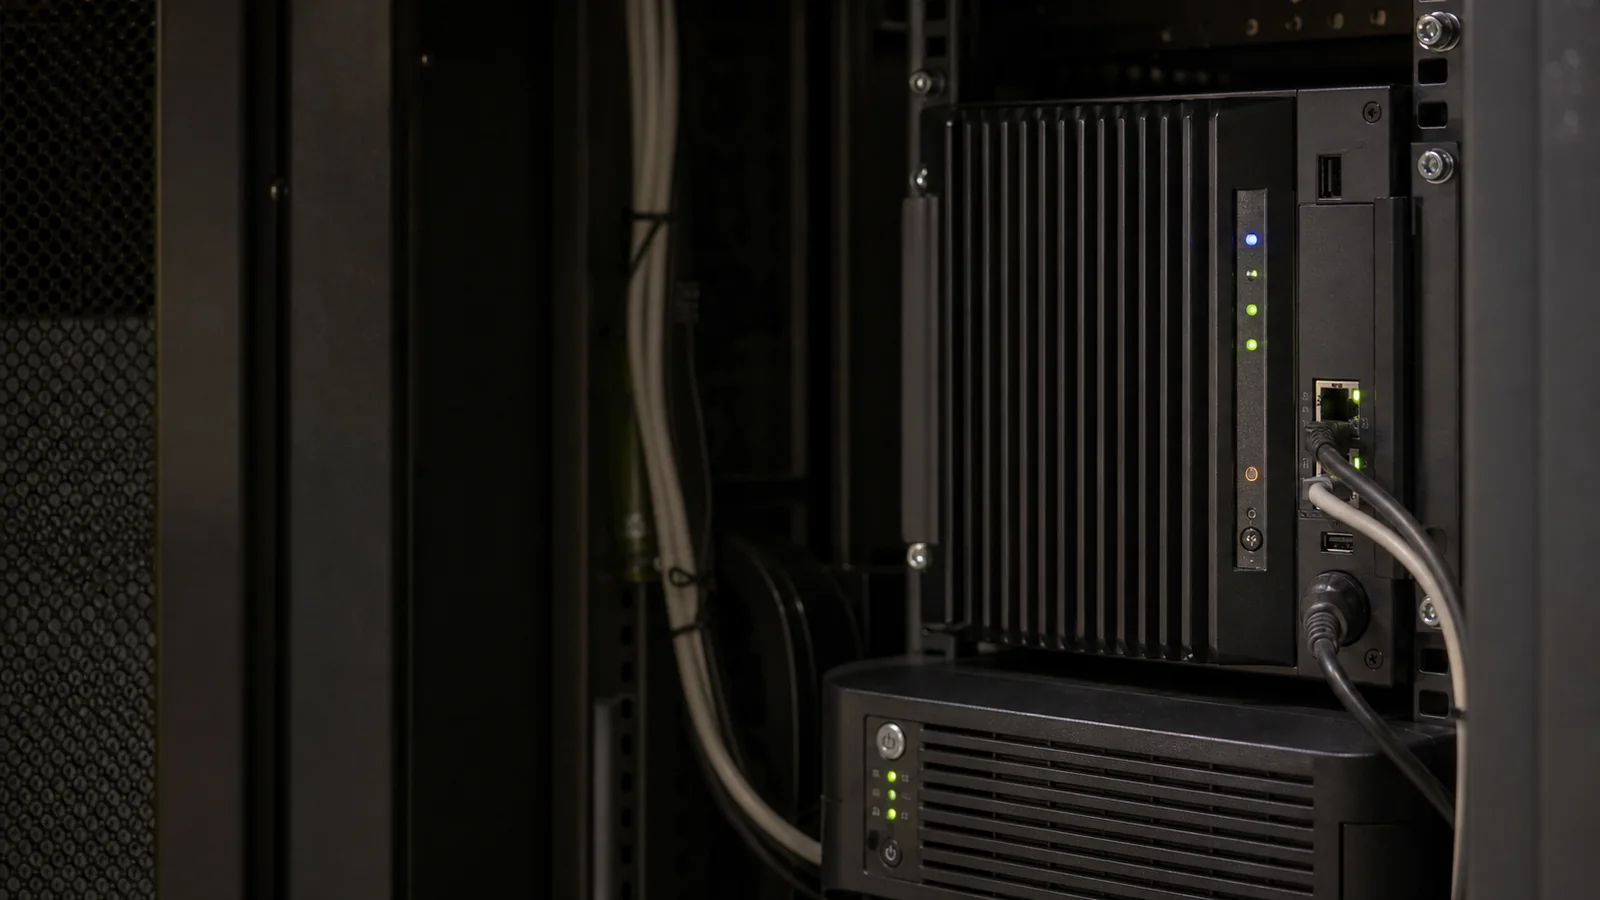
Monitoring is the feedback loop of an edge system
An edge node is often installed where it cannot be inspected every day: beside a production line, in a back office, at a warehouse, in a utility room, or at a remote collection site. It may be acquiring video, polling devices, recording data, executing automation rules, running a model, and serving browser clients at the same time. A failure in any one of those functions can reduce the usefulness of the entire system.
Edge monitoring software turns that local runtime state into an operational signal. It gathers resource and workload metrics, attaches them to a known node, makes them visible to users, retains the evidence that matters, and enables focused automation when a threshold or trend deserves a response. The objective is not to collect every counter. It is to detect degradation early enough to preserve data and avoid unnecessary site visits.
Banalytics supplies this capability through the System Monitor, event handling, local history, dashboards, and controlled remote access. The monitor runs on the same Agent that performs local work, so its measurements describe the actual edge runtime rather than an inferred cloud-side view.
Observe four layers, not one host metric
| Layer | Questions to answer | Banalytics signals |
|---|---|---|
| Host resources | Does the machine have enough compute, memory, and disk to continue its role? | General CPU load, system memory, filesystem capacity and usable disk space. |
| Runtime health | Is the Agent stable, and is its own resource use increasing unexpectedly? | Uptime, current/daemon/peak thread counters, Banalytics JVM memory, and native/C++ memory where available. |
| Workload activity | Is the node processing the expected number of sources and streams? | Active audio/video streams, media activity, events, recording and task state. |
| Remote service | Can users preview, transfer data, and manage the node without accumulating transport pressure? | Active users, WebRTC buffer state, connection and message metrics. |
The System Monitor publishes a System state event at a configured interval. CPU is sampled across the interval; memory, disk, thread, and network figures are point-in-time values when the event is emitted. This distinction matters when interpreting a spike: a sustained CPU problem and a one-off snapshot are not the same operating condition.
Start with the node’s own operating state
The native System Monitor view provides the most direct diagnostic picture of an Agent. It exposes uptime, current and peak thread counts, host and Banalytics CPU use, JVM and system memory, native memory, RTC buffers, active streams, free disk capacity, and the measurement refresh interval. This is the correct first view when a node needs investigation because it keeps the resource state and the runtime that generated it together.
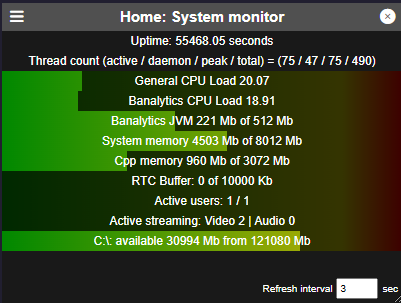
Disk is especially important for a recording or data-collection node. It should be treated as an early-warning signal rather than the only retention mechanism: use monitor events to identify shrinking headroom, and use the configured File Storage retention and cleanup policy to manage the data lifecycle deliberately.
Turn a health measurement into a focused operational response
A metric becomes useful when its meaning is explicit. For example, low free disk might produce a warning first, then an escalation if the value continues to decline; a growing WebRTC buffer might trigger a diagnostic event rather than an immediate restart; a failed acquisition task may justify a narrow task restart before an Agent-level action is considered.
Banalytics routes System Monitor snapshots through the same event architecture used for device and workflow events. The Event Manager can apply filters, time windows, and actions to the conditions that matter. Event History can retain selected state changes for later audit or investigation. Avoid attaching heavyweight actions to every high-frequency monitor event: the monitoring system should reduce uncertainty, not become a new source of load and noise.
| Condition | Preferred first response | Escalation principle |
|---|---|---|
| Low usable disk space | Notify the operator; verify retention and archive/cleanup policy. | Escalate before recording or file export is at risk; do not rely on manual cleanup as the primary design. |
| High Banalytics CPU | Correlate with streams, decoding, model activity, and recent configuration changes. | Reduce workload or tune the specific task before changing global host limits. |
| Rising native memory | Inspect codecs, frame buffers, model workers, and direct-memory settings. | Do not assume a larger Java heap fixes a native-memory issue; use JVM Settings and measured evidence. |
| Growing RTC buffer | Inspect active viewers, media bitrate, and available outbound bandwidth. | Treat it as a remote-preview capacity problem unless other signals show a broader node failure. |
| Unstable task or component | Restart the smallest affected runtime scope. | Reserve full Agent restart for cases where task- or component-level recovery cannot restore service. |
Use a custom dashboard when a team needs a faster decision surface
The native monitor is the source of runtime state. Some operating teams also need a focused view tailored to a single question-for example, whether CPU and memory remain inside a commissioning envelope over the last few minutes. Banalytics D3JS charts can use Remote API calls, polling, live events, or historical loading followed by real-time updates to build that kind of view on the Agent.
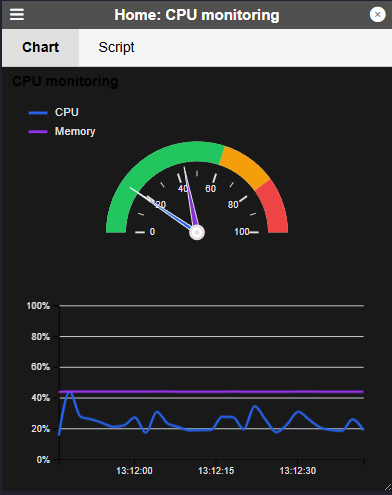
Custom visualisation should not duplicate the whole console. It should make one operating decision faster: identify a sustained trend, compare node capacity, watch a specific line during commissioning, or show a business user whether a local service is within its agreed operating envelope. The dashboard architecture and providers are documented in Dashboards and D3JS Charts.
Choose the interval for the question being asked
More samples are not automatically better monitoring. A short interval improves visibility during commissioning and active troubleshooting but creates more events and a noisier history. A long interval is lighter on a constrained node but may hide a short-lived condition that matters to the workload.
| Operating mode | Suggested interval | Use it for |
|---|---|---|
| Normal operations | 5 seconds | Balanced current-state monitoring for routine systems. |
| Commissioning or incident analysis | 1–2 seconds | Short investigations where fast change detection is more valuable than a compact event history. |
| Long-term audit | 10–30 seconds | Selected health history and capacity trends with lower storage and rule volume. |
| Low-resource node | 15–60 seconds | Basic visibility where frequent processing of monitor events would be disproportionate to the workload. |
Use a faster profile temporarily and return to the normal operating interval once the diagnostic question is resolved. The System Monitor documentation describes the available range and the meaning of each published metric.
Build monitoring into the edge deployment from day one
- Define the node’s operating envelope. Document expected streams, recording rate, CPU headroom, memory use, disk retention, and remote-viewer capacity.
- Enable System Monitor at an appropriate interval. Start with the default operational profile and adjust only when a measured requirement justifies it.
- Choose a small set of meaningful health events. Use thresholds and persistence rules that distinguish a sustained problem from ordinary variation.
- Connect events to the right response. Notify, retain history, restart the narrow affected scope, or open a diagnostic workflow according to the condition.
- Add purpose-built dashboards where they improve decisions. Use D3JS or dashboard providers for trends and views that matter to a particular operator group.
- Review after every workload change. A new camera, model, codec, browser usage pattern, or retention policy can alter the resource profile of the node.
Edge monitoring software is not an add-on after deployment. It is the operating discipline that allows a distributed system to remain trustworthy as devices, workloads, and sites change.