Critical Infrastructure Monitoring
Local observability for distributed engineering assets, with explicit operational boundaries and resilient data paths.
Critical infrastructure cannot be monitored as a collection of disconnected alarms. Operators need a trustworthy picture of local asset condition, signal quality, site-node health, and the events that led to an exception-even when the network path to a central system is impaired.
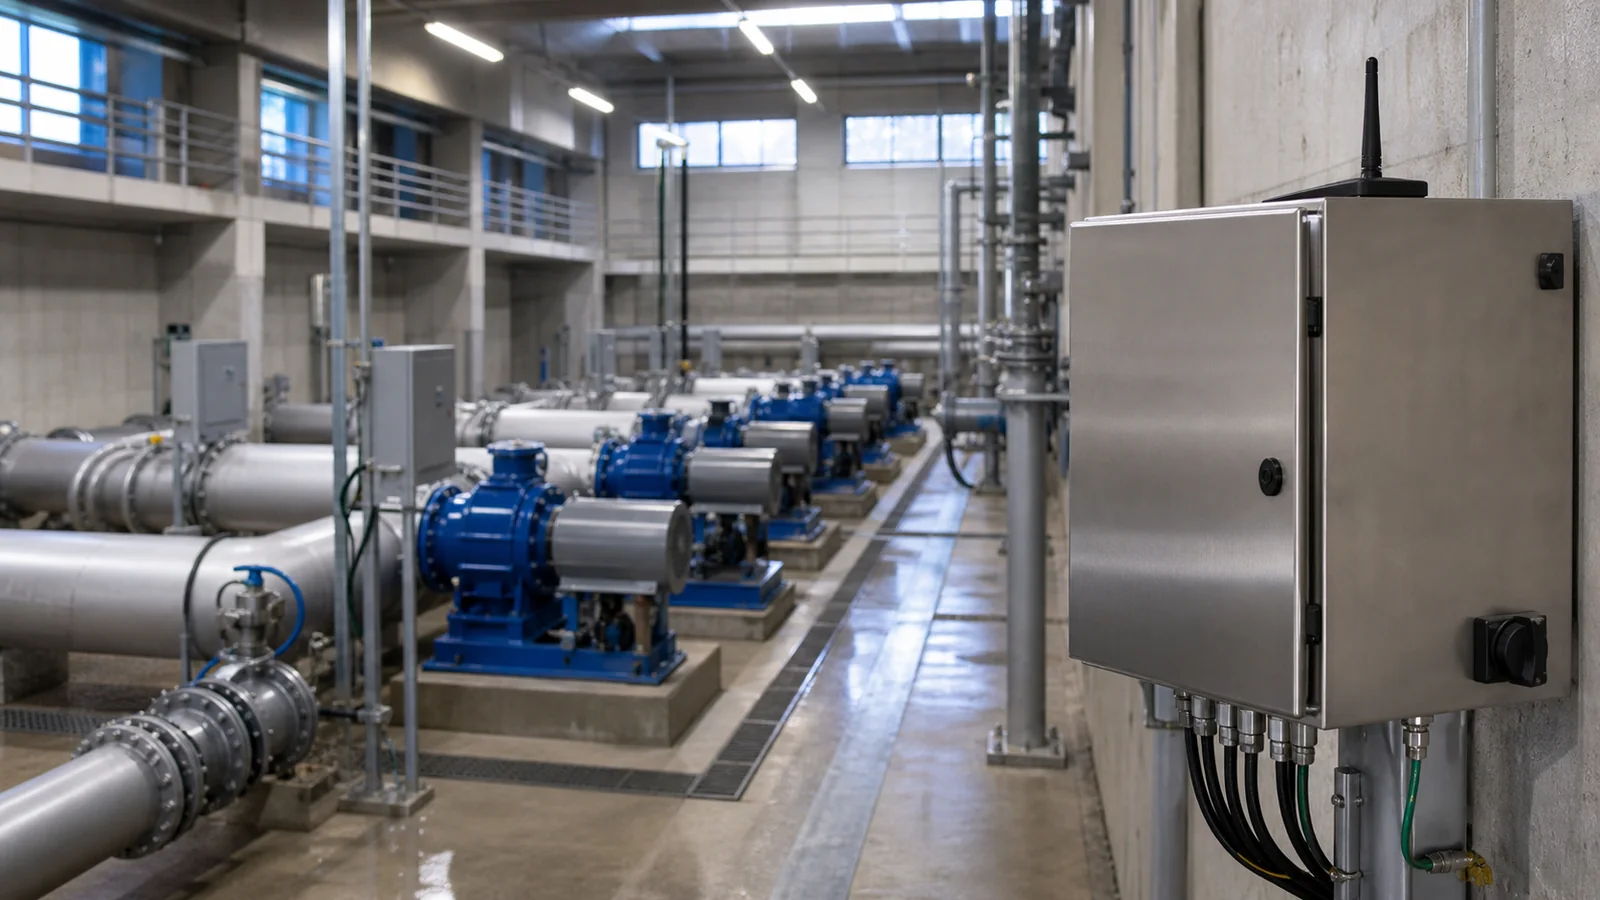
Availability depends on context, not alarm volume
Water, energy, transport, telecommunications, facilities, and public-service estates are made up of many local systems with different owners, operating modes, maintenance windows, and risk profiles. An unavailable sensor, an overloaded edge host, a cabinet-door event, a camera observation, and a communication failure may all be relevant-but they do not carry the same urgency or call for the same response.
A monitoring architecture must therefore preserve context. Every operational event should be traceable to its source, location, time, quality, and responsible system. The site should continue collecting and assessing its local state through a backhaul outage, while the central operational view receives only the data needed for coordination, escalation, and audit.
Banalytics provides a local orchestration and observability layer around connected physical systems. An Agent runs on a Windows, Linux x86_64, or Linux ARM64 host at the site; it acquires defined inputs, manages components and tasks, produces events, and exposes selected results to dashboards and integrations. Read What is Banalytics? for the platform overview.
Separate the asset, the site, and the shared operations view
| Monitoring scope | Question it answers | Examples of evidence |
|---|---|---|
| Physical asset | Is the connected equipment reporting the expected state and is its data credible? | Device value, update time, signal or communication state, threshold event, controller status, camera observation. |
| Local process | Is the site condition within its defined operational envelope? | Correlated sensor state, local rule result, event history, retained media or data, operator acknowledgement. |
| Edge node | Can the local monitoring and integration workload continue to operate? | CPU, memory, disk, thread, media, WebRTC, and user-activity metrics. |
| Connectivity and integration | Are the selected data paths, consumers, and site-to-site links behaving as expected? | Message freshness, connection state, publication failure, remote-session status, external acknowledgement where available. |
| Shared operations | What needs cross-site prioritisation, maintenance planning, or escalation? | Governed dashboards, selected alarms, status summaries, event history, and authorised remote support. |
This separation prevents a common failure mode: treating the absence of a central dashboard update as proof that the local asset itself has failed. A good event model makes the difference visible-for example, between a sensor threshold, a stale device value, a local disk-capacity warning, and an unavailable upstream consumer.
Keep the site monitoring path operational when the uplink is not
At a critical site, the local edge node should retain ownership of the responsibilities that cannot wait for an external service: device acquisition, data validation, local evidence retention, event creation, and the handoff to the system or operator authorised to act. The remote layer is then a valuable operational view, not a single point through which every field signal must travel.
The Banalytics Agent can connect to common local interfaces including cameras, Modbus equipment, MQTT devices, ZeroMQ services, files, and custom processes. The Modbus Line component supports serial and network variants, multi-device polling, device state tracking, and event generation. The embedded MQTT Server provides a secured local publish/subscribe boundary for field devices, gateways, and applications. These interfaces should be selected because they fit a documented site contract, not simply because they are available.
For every integration, specify source ownership, expected update rate, timestamp behaviour, value units, acceptable ranges, authentication, loss-of-connection behaviour, and the meaning of missing data. An apparently normal value without its age or quality may be more dangerous than an explicit fault, because it can lead an operator to assume that a stopped data flow is still current.
Turn observations into bounded, explainable operational events
Critical-infrastructure monitoring needs more than raw telemetry. It needs rules that combine the relevant evidence and produce an outcome a responsible team can interpret: a pressure value remained outside a defined range for a defined period; a cabinet sensor stopped updating; a camera detected activity in a restricted area; a site node has insufficient storage to retain its required evidence; or a remote connection is unavailable while the local process remains healthy.
Banalytics Event Manager evaluates events against configured conditions and invokes preconfigured actions. It can support controlled flows such as notifying an on-call team, retaining a recording, publishing a concise MQTT message, or sending an integration-specific event to an external system. Each rule should identify its inputs, timing, suppression or deduplication behaviour, severity, expected human response, and escalation owner.
Where visual observation is relevant, local YOLO detection can create object-detection events from camera inputs. This does not make a visual model a safety instrument or final authority. The project team must validate the model against the site conditions, define confidence thresholds and review paths, and retain the dedicated safety, protection, and control systems that hold statutory or engineering authority.
Use geography to reduce the time from event to site context
For a distributed estate, a geographic dashboard helps an operator connect an event to the place, asset group, and active evidence that explain it. It can show site markers, defined areas, camera views, historical events, logs, and Agent-health components in the same operational workspace. The dashboard is a context surface: it should not obscure source timestamps, data quality, access restrictions, or the system that owns the response.
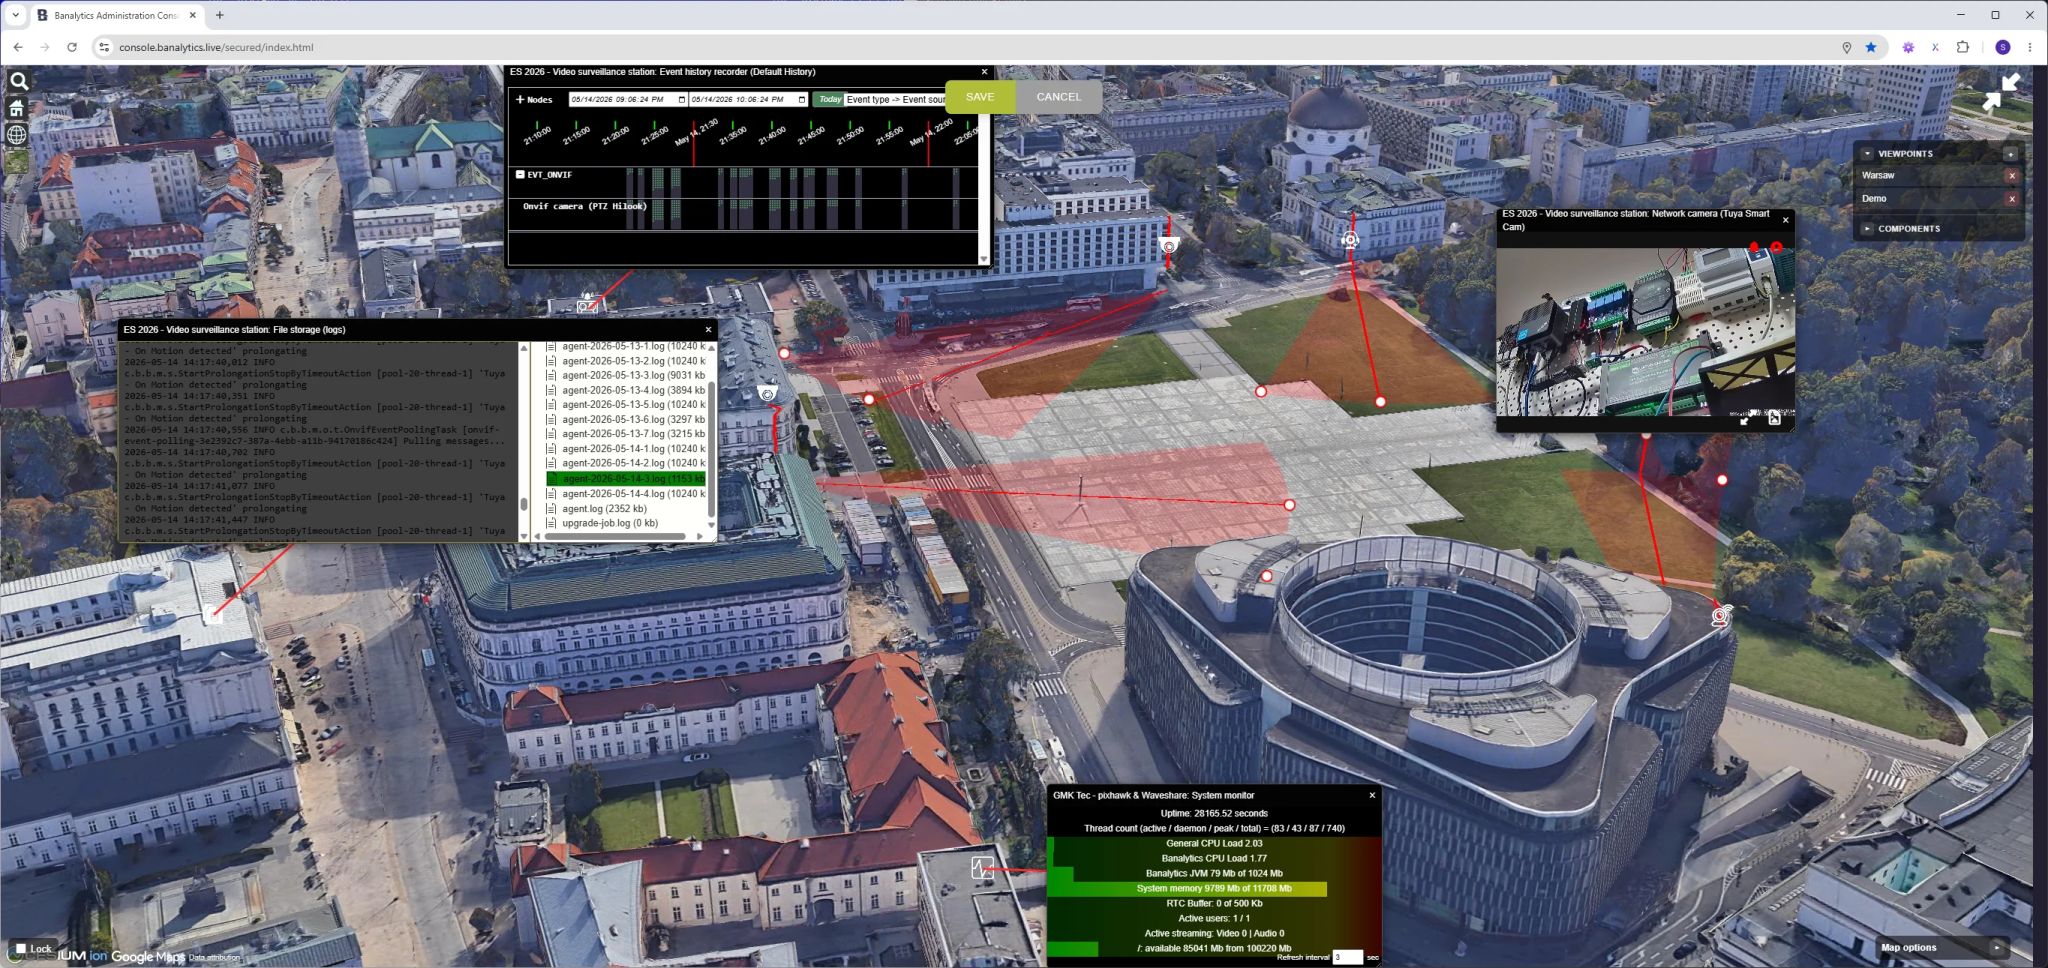
Banalytics dashboards are Agent-owned: their hierarchy, pages, access rules, and provider configuration are kept with the Agent, while the portal provides the editor and viewer. Deployments can select a Cesium, Mapbox, or OpenStreetMap dashboard provider according to the desired geographic context. Restrict live site positions, asset attributes, and third-party map credentials to the roles that need them.
Monitor the monitoring system as part of the service
Field-device state is incomplete without node health. A system may still accept local values while disk capacity is nearly exhausted, memory pressure is growing, a camera stream has failed, or a remote-viewing workload is consuming the available network budget. Monitoring the Agent is therefore part of monitoring the critical process around it.
Banalytics System Monitor publishes CPU, memory, disk, thread, media, WebRTC, and user-activity metrics as System state events. Pair these metrics with source-freshness events and a clear runbook. Low disk may call for retention review; an old Modbus value may need field diagnosis; a high remote buffer may indicate a browser or network problem. A blanket restart is not a response strategy.
- Test loss of upstream connectivity. Confirm what continues locally, what is retained, which alarms are generated, and how shared operations recognise a temporary communications loss.
- Define data retention and evidence handling. Set locations, durations, cleanup rules, access scope, and export procedures for every retained event, measurement, image, or recording.
- Keep time trustworthy. Establish a time source and document timestamp handling across devices, the Agent, and external consumers; correlation cannot be reconstructed reliably from ambiguous time.
- Plan remote recovery. Document site access, power recovery, credential rotation, configuration backup, version management, and the physical interventions a remote team cannot perform.
- Protect the boundary. Use authenticated interfaces, role-scoped access, and explicitly owned integration contracts before exposing a site node to wider networks.
Make the authority boundary explicit
Critical-infrastructure projects bring together operational technology, IT, maintenance contractors, security teams, public authorities, and domain specialists. An event is only valuable when someone is authorised and prepared to act on it. Before deployment, agree the operational owner, severity model, notification path, expected acknowledgement, escalation rule, and the evidence retained for each class of event.
Banalytics should be positioned as an edge orchestration, monitoring, and integration layer. It must not be represented as a replacement for independently engineered protection relays, safety instrumented systems, emergency controls, statutory command systems, or the domain-specific platforms that hold decision authority. The designated system and accountable operator retain their defined role.
Scale from one accountable site pattern
- Choose a bounded service outcome. Start with one station, cabinet group, facility, or asset class whose owner and response path are known.
- Document the site contract. Define devices, data semantics, local processing, retention, authorised consumers, access roles, health signals, and outage behaviour.
- Prove the local path first. Test acquisition, event creation, evidence retention, and the intended site response without the upstream link.
- Validate the shared view. Check that dashboards, alerts, history, and integrations show source, time, quality, and responsibility clearly enough for actual operators.
- Exercise failure modes. Simulate stale data, device loss, full storage, a blocked external consumer, and an unavailable remote session; refine the runbook from the result.
- Replicate deliberately. Reuse the pattern for comparable assets and record the deviations required by each domain, location, and regulatory context.
Critical infrastructure monitoring is not the accumulation of more screens and alerts. It is the disciplined creation of trustworthy local evidence, resilient operational context, and clearly owned actions across a distributed estate.